The latest GRAF® weather model improvements
Continue reading


Key Takeaways
- Relying on deterministic, single-point weather forecasts introduces hidden operational risks by failing to account for low-probability, high-impact “tail events.”
- The cost-loss decision framework allows operational leaders to evaluate the financial threshold where taking protective action outweighs potential damages.
- The Weather Company’s Forecast on Demand engine evaluates 150+ models—both deterministic and ensemble—to deliver confidence intervals, 10th/90th percentiles, and 100 Monte Carlo simulation scenarios via API.
- Industries spanning energy, CPG retail, and agriculture leverage probabilistic forecasts across time horizons ranging from hours to 7 months out to optimize supply chains and protect critical assets.
In enterprise operations, uncertainty is often the single greatest source of hidden cost. Yet for decades, businesses have relied on deterministic, single-point weather forecasts to make high-stakes operational choices. While a single number offers simple clarity, it hides critical operational insights that fall outside standard predictions.
Below, I explore how operational leaders can use probabilistic weather intelligence to analyze hundreds of potential weather scenarios to quantify uncertainty, evaluate cost-loss thresholds, and make mathematically sound risk management decisions.
Q: Why does relying on a single weather forecast create hidden operational risk?
A: Single-point, deterministic forecasts, such as predicting exactly 32°F or 5 inches of snow, give a false sense of certainty because operations rarely fail on what is most likely — they fail on unexpected tail risks. Focusing solely on the single most probable outcome obscures extreme scenario probabilities that carry catastrophic financial or operational costs.
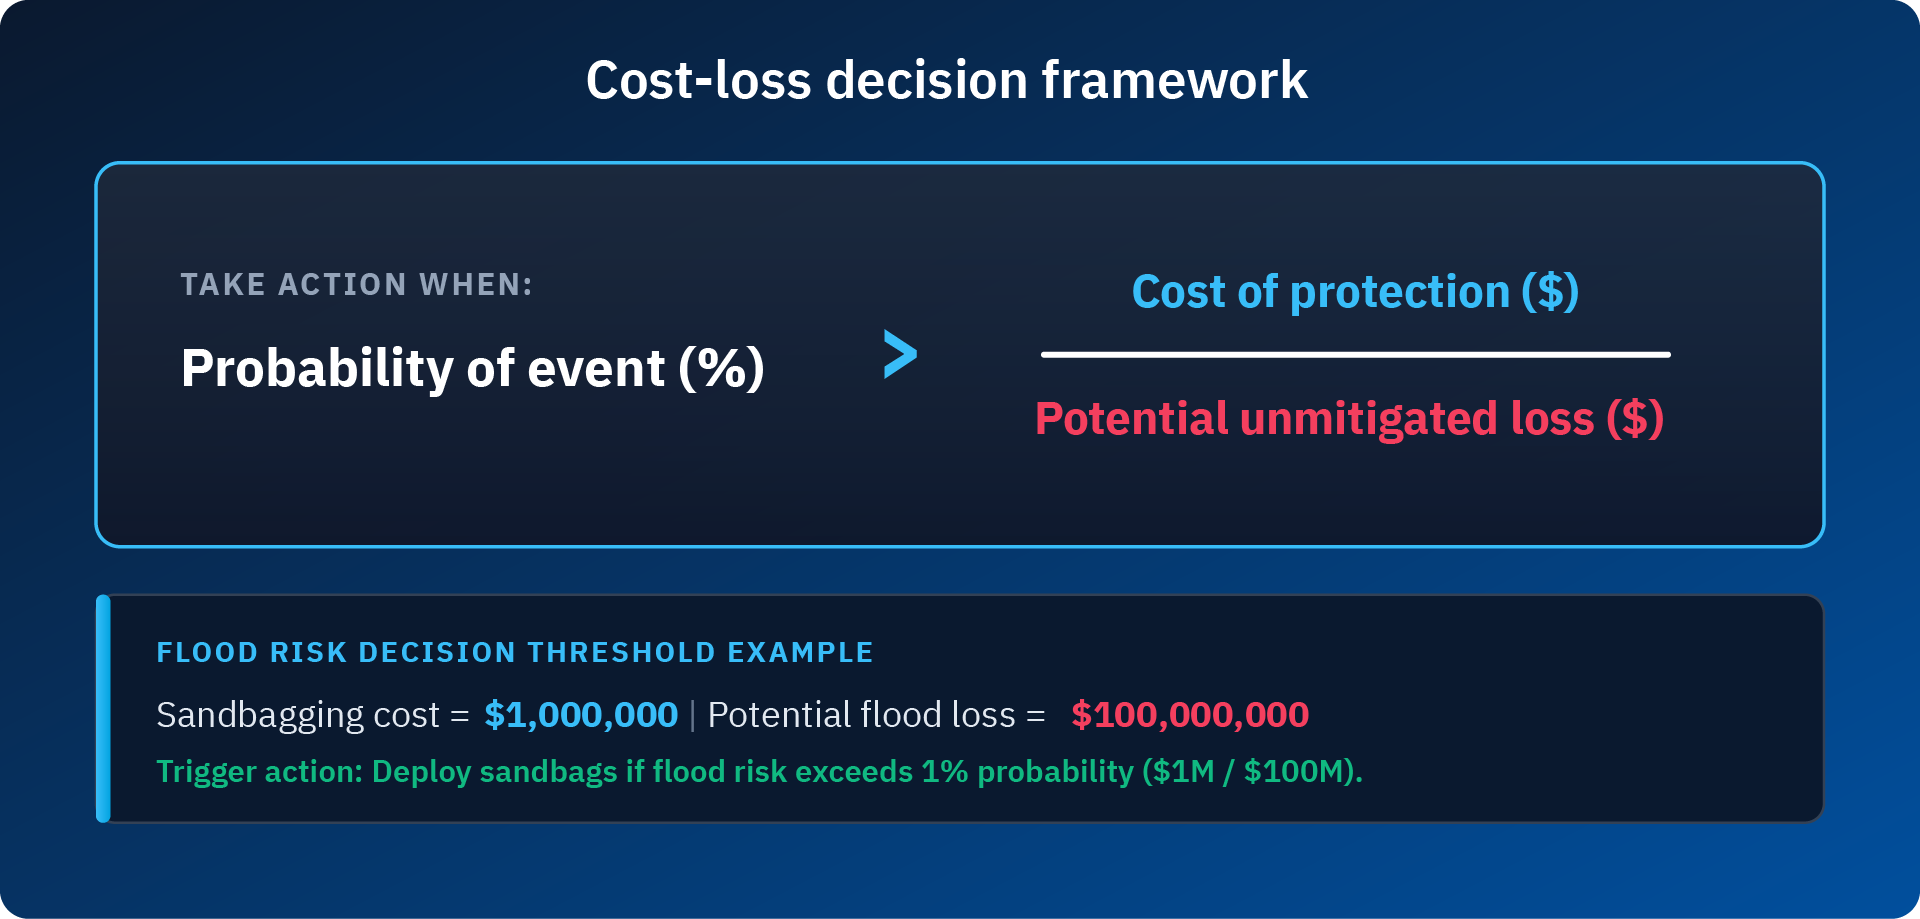
In enterprise decision-making, evaluating weather risk relies on a concept known as the cost-loss decision framework. This framework balances the cost of taking a preventative action against the financial loss incurred if an unmitigated weather event hits.
Q: What are some examples of the cost-loss decision framework in action?
A: Here are three very probable examples of the cost-loss ratio and how it applies to different weather-impacted scenarios.
First, let’s consider a river flooding forecast where water levels are projected to rise to two feet below a levee:
- Deterministic approach: The forecast projects no breach, leading decision-makers to do nothing.
- Probabilistic approach: The forecast shows a 5% probability of the river topping the levee, which would result in $100 million in structural damages.
- The decision: Deploying sandbags costs $1 million. Under the Cost-Loss Framework, taking action becomes financially optimal at just a 1% probability threshold ($1M cost / $100M loss = 0.01). Spending $1M to hedge against a 5% risk of $100M in damages is the mathematically correct business choice.
Next, imagine an airline flight dispatch forecast into a hub airport where convective weather or wind shifts may trigger a ground stop or sudden runway configuration change:
- Deterministic approach: The single-value forecast projects standard arrival operations and clear flight corridors, leading dispatchers to load zero contingency holding fuel.
- Probabilistic approach: The ensemble forecast shows an isolated 20% probability of convective storms causing a ground stop and holding patterns that would force a flight diversion, resulting in $110,000 in diversion costs from extra fuel burn, passenger misconnections, and irregular gate operations.
- The decision: Loading 4,000 pounds (~600 gallons) of contingency fuel costs $1,650. Under the cost-loss framework, taking action becomes financially optimal at just a 1.5% probability threshold ($1,650 cost / $110,000 loss = 0.015).
For the third example, consider an overnight freeze forecast for a hobby strawberry farm with 50 acres where sub-freezing temperatures threaten open blossoms:
- Deterministic approach: The point forecast projects an overnight low of 34°F—safely above freezing—leading the grower to keep irrigation pumps turned off.
- Probabilistic approach: The calibrated ensemble indicates a 5% tail risk probability of temperatures dropping to 28°F, which would cause severe blossom damage and result in $1.5M in lost strawberry crop yield (~$30,000/acre).
- The decision: Running continuous overhead sprinklers overnight to encase and protect the crop through latent heat release costs $2,500 in pumping fuel, water, and labor. Under the Cost-Loss Framework, taking protective action becomes financially optimal at just a 0.17% probability threshold ($2,500 cost / $1,500,000 loss = 0.0017).
Q: How does The Weather Company generate probabilistic forecasts?
A: The Weather Company’s Forecast on Demand (FoD) engine powers probabilistic intelligence by ingesting data from over 150 deterministic and ensemble weather models, applying a consensus modeling approach to deliver a full probability distribution and confidence score across both space and time.
What I mean by that is, while a deterministic weather model runs a single simulation based on one best estimate of starting conditions to predict one exact outcome, an ensemble model runs dozens of simulations with slight variations to reveal the range of possibilities and their odds. Unlike legacy systems that output static figures, this engine provides statistical clarity across short-term and long-range planning horizons.
Through our weather data API integration, organizations can request 100 equally likely forecast scenarios to run directly through internal Monte Carlo simulations or pull standardized percentile risks (such as 10th and 90th percentiles) to automate operational trigger thresholds.
| Feature | Deterministic forecasting | Probabilistic forecasting |
| Primary output | Single most likely value (e.g., 32°F, 2 inches of rain) | Range / Statistical Distribution (e.g., 10th to 90th percentile) |
| Data ingestion | 150+ deterministic and ensemble models | 100+ deterministic and ensemble models |
| Risk visibility | High risk of hidden tail event, or bi-modal (2 likely outcomes) failures | Quantifiable uncertainty & percentile risk modeling |
| Data delivery | APIs serving hourly forecasts out 15 days for point-in-time variables | APIs serving hourly out to 15 days with 100 Monte Carlo simulation runs (prototypes), percentiles, bins, and probability of user-input threshold exceedance |
| Primary business value | Sets the target and aligns on execution | Quantifies risk and uncertainty for running financial risk cost/loss models |
Q: How are energy and utility companies leveraging probabilistic weather forecasts?
A: Utility companies use probabilistic forecasts to satisfy regulatory mandates like Dynamic Line Ratings (DLR) / Ambient Adjusted Ratings, allowing grid operators to safely optimize power throughput across transmission lines during extreme atmospheric conditions.
Transmission lines act like physical pipes—they expand and contract based on ambient temperature, wind speed, and solar radiation, impacting how much electricity can safely pass through them.
- The Challenge: During severe summer heatwaves, widespread air conditioning usage spikes electricity demand. However, high ambient temperatures constrict the capacity of transmission lines.
- The Solution: By applying probabilistic forecasting, utility operators evaluate tail-risk weather scenarios rather than relying on conservative static assumptions. This gives grid operators the high confidence required to maximize line throughput and prevent blackouts or forced curtailments while maintaining grid safety.
Q: How can retail and consumer goods companies apply long-range probabilistic forecasting to supply chains?
A: Retailers and CPG companies use long-range probabilistic confidence intervals — extending out up to seven months — to align inventory positioning, seasonal fuel blending, and logistics with impending weather shifts.
One clear example is occurring in fuel retail:
- Temperature Thresholds: Fuels like winter-blend diesel and biodiesel have strict temperature thresholds below which they gel or degrade.
- Supply Chain Lead Times: Ordering, blending, and distributing specialized fuel formulations takes anywhere from several days to several months.
- Operational Execution: Gas stations employ data analysts who ingest 15-day high-resolution probabilistic forecasts and 7-month seasonal confidence intervals. This ensures the correct fuel blend arrives at the pump before severe cold weather hits, protecting consumer vehicles and preventing distribution bottlenecks.
In the broader retail and CPG space, probabilistic models can help defend against the risk of weather-driven stockouts for just-in-time replenishment. Depending on the product, the fallout of stockouts can cause a loss of basket sales, customers going to competitors, or be severe enough to cause PR disasters such as France’s stockouts of air conditioners during France’s hottest recorded day.
Other examples include critical seasonal apparel shifts. Weather impacts retailers’ decisions to hold onto inventory rather than discounting for a delayed seasonal shift or when to shift seasonal apparel early to outbid competitors.
Another critical concept is one-time-buy seasonal products that have a very limited purchase window. This is common for lawn and gardening products, where consumers buy a new hose for the first spring day or replace outdoor decorations for Halloween or other holidays. Once behind on meeting seasonal shifts in consumer demand, the bullwhip effect takes over, causing supply issues to become progressively amplified as they travel upstream from retailers to wholesalers, distributors, and manufacturers.
Q: How can short-term probabilistic forecasts protect high-value agricultural crops?
A: In agriculture, short-term probabilistic forecasts enable precision mitigation techniques — such as deploying helicopters or running irrigation systems — by calculating the exact likelihood of freeze events against operational intervention costs.
Working alongside specialized meteorological consultants, farm managers evaluate probabilistic frost risks to make time-critical decisions:
- Ice encasement: If temperatures are projected to drop just below 32°F, strawberry farmers can spray crops with water. As the water freezes into ice, it releases latent heat, encasing and protecting the fruit.
- Helicopter inversion mixing: In extreme cold during early morning hours, farms deploy helicopters to fly over fields. The blades push warmer thermal inversion air down to the surface, keeping crops above freezing.
The Economics: Sending out helicopters costs roughly $5,000 but protects $150,000 worth of crops. Ingesting real-time probabilistic data ensures growers only trigger these expensive operations when the probability of damage crosses their economic break-even point.
Tracking probabilistic trends at key points is critical for making the most cost-effective decisions. There is a limited inventory of helicopters available for hire for this type of frost mitigation, so securing aircraft several days in advance can be the difference between having or not having an executable strategy. Conversely, cancellation costs can rise from a fraction to the entire cost of the hire depending on timing.
Moving beyond single-point deterministic forecasts allows enterprises to stop reacting to unexpected weather events and start managing weather risk with precision. Whether optimizing energy grid throughput, balancing retail supply chains, or deploying targeted crop protection, probabilistic weather intelligence equips business leaders with the confidence intervals needed to safeguard bottom lines.
Frequently asked questions
A deterministic forecast delivers a single expected value (e.g., “it will be 32°F”). A probabilistic forecast provides a range of potential outcomes along with their likelihoods (e.g., “a 90% chance of 30°F–34°F and a 5% chance of dropping to 26°F”), allowing decision-makers to evaluate tail risks.
A Monte Carlo simulation runs multiple model iterations using slightly varied starting atmospheric conditions to generate hundreds of possible future scenarios. This helps enterprises stress-test operational workflows against all plausible outcomes.
Probabilistic forecasts range from high-resolution, short-term tactical views (1 to 15 days out) for immediate operational response up to extended seasonal confidence intervals (up to 7 months) for strategic supply chain planning.
In the US, utilities are mandated by the Federal Energy Regulatory Commission (FERC) via Order 881 to adopt Ambient Adjusted Ratings (AAR) (based on ambient temperature fluctuations) for power transmission capability and explicitly recognize Dynamic Line Ratings (DLR) as added benefits. In addition, the Department of Energy (DoE) heavily funds grants supporting DLR modernization through the GRIP (Grid Resilience and Innovation Partnerships) program, dispersing $10.5B in funding to establish Smart Grids and Grid Resilience. The EU is also supporting DLR investment driven by clean energy initiatives such as EU Regulation 2019/943.