The latest GRAF® weather model improvements
Continue reading

Key takeaways
- Enterprise spatial weather data goes beyond static visual overlays, enabling 3D route sampling, automated polygon alerting, and multidimensional API integration.
- Traditional GIS engines struggle with rapidly changing weather data; SSDS converts continuous grids into tile pyramids cached on global edge networks for delivery in milliseconds.
- Micro-topography means traditional single ZIP Codes or lat/long points miss critical operational risks.
- SUN Spatial Data Systems (SSDS) unlocks access to over 2,000 gridded and vector spatial layers along with 10+ years of historical source data for operational audits and replays.
Weather isn’t a background variable for enterprise teams. It’s a live, operational input that directly affects routing decisions, workforce deployment, inventory timing, energy load planning, and risk exposure across thousands of locations at once.
Yet, when most B2B leaders think about incorporating weather into their operations, they picture a basic 2D map — a radar loop sweeping over a region, a satellite overlay, or a simple temperature heat map. For basic situational awareness, that visual snapshot is enough.
But visualizing weather on a flat map doesn’t solve complex enterprise problems. Assets move, forecasts evolve, and decisions happen across four dimensions.
Meeting those multidimensional business needs requires serious processing capacity behind the scenes. Weather data updates continuously, spans terabytes of incoming inputs every day, and powers live features — like local airport radar sweeps — that must refresh on screen every single minute.
To bridge the gap between static map visuals and dynamic enterprise workflows, we built SUN Spatial Data Systems (SSDS).
While SSDS traditionally served as the core engine rendering maps across our consumer and enterprise applications, we’ve expanded its reach. We’re moving beyond flat map tiles to unlock the full depth of global weather intelligence across space, time, and altitude through custom, high-performance APIs.

Explore and evaluate a full range of APIs designed to propel your business forward.
Start a free 30-day API trialHere’s how we built SSDS to solve the toughest spatial data engineering challenges — and why traditional mapping APIs fall short for modern enterprise needs.
What geospatial data is and why a traditional GIS struggles with fast updates
To understand why custom architecture is necessary, it helps to start with the basics.
What is geospatial data?
Geospatial data is any information that combines location coordinates on Earth with specific attribute details, such as surface temperature, atmospheric pressure, or wind speed.
What is geospatial analysis?
Geospatial analysis is the practice of processing location-based information to identify spatial patterns, evaluate geographic risks, and automate operational decisions.
Most corporate environments rely on traditional Geographic Information System (GIS) platforms like Esri or ArcGIS for spatial data analytics. A traditional GIS excels at layered analysis of static assets, such as property boundaries, utility lines, or transit networks. Weather data is an entirely different beast.
Fast-moving data vs. legacy spatial engines
Environmental datasets present three distinct challenges that break standard systems:
- Extreme velocity: Data isn’t updated weekly or monthly; scans and forecasts arrive on demand, every minute or every hour.
- Massive volume: High-resolution global models generate continuous terabytes of gridded data points.
- Low latency demands: Mission-critical operations — like aviation flight planning or real-time storm tracking — require instant data rendering. A delay of a few seconds can impact operational safety.
Generic mapping platforms struggle under high throughput. They either force software teams to download complete global files or reduce data resolution to make point lookups manageable.
How SSDS solves it: Edge-cached tile pyramids
When SSDS receives raw environmental files, it converts continuous grids into a structured tile pyramid and stores the result in high-speed memory.

Then, when an enterprise application requests an overlay, SSDS delivers the required tile in milliseconds. Because every layer shares a uniform projection, requests cache directly onto global edge networks (like Fastly).
This speed is a major competitive differentiator. While competitor APIs force clients to pull heavy global files or wait on origin server processing, SSDS serves data directly from the edge closest to the user. In live operational environments — like aviation flight planning — this architecture gets active radar sweeps onto screens faster than premier single-site radar applications, giving decision-makers instant situational awareness when seconds count.
Whether a single analyst or thousands of concurrent users request a specific grid area, the content serves directly from the edge without straining back-end servers.
Moving beyond flat maps by sampling across space and time
A 2D map shows where weather is right now. Enterprise decisions depend on how assets move through space and time. A delivery truck or a commercial flight doesn’t sit still in a single grid cell; it moves along a trajectory.
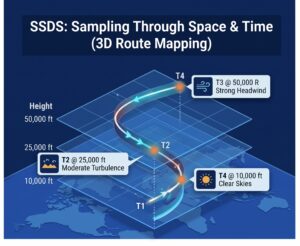
To support these workflows, we’ve built new API services within SSDS that reframe how businesses run spatial data analytics.
The multi-point service (Route-based sampling)
Instead of pulling static map overlays, platforms can submit routes defined by coordinates, timing, and elevation:
- Logistics & fleet routing: Submit a 5-hour driving route from Point A to Point B. The API queries wind, fog, wet roads, and precipitation at the exact time and location the vehicle will be passing through.
- 3D aviation flight paths: Aviation data requires vertical scale. SSDS samples across 50 flight levels (every 1,000 feet up to 50,000 feet), delivering turbulence, icing potential, and wind vectors along an aircraft’s full takeoff, cruise, and landing profile.
- Utility & energy grid sampling: Multi-point isn’t limited to moving paths. An electric utility can submit a single request covering 1,000 stationary power stations across a region to retrieve localized wind forecasts for every asset in a single API call.
Feature extraction for lightweight alerting
Raw grid files contain millions of points, making them heavy to process on mobile devices. Our Featurizer API scans heavy raster files and isolates specific threshold conditions into light vector polygons.
Example: Instead of downloading a huge temperature grid to find freezing risks, a fleet operator can query Featurizer for “areas where temperature is below 32°F overnight.” Featurizer returns light, bounding vector polygons that can be overlaid directly into decision logic or alerting engines.
Direct radar streaming
Through specialized single-site services, we deliver raw radial radar sweeps directly from national weather networks and airport stations. By streamlining processing pipelines, our architecture delivers active radar scans to user screens faster than dedicated single-site tools.
Micro-topography: Why ZIP Codes and single lat/longs fail
A common mistake in enterprise planning is relying strictly on single ZIP Codes or isolated latitude and longitude points.
In reality, weather changes drastically over very short physical distances due to topography and elevation:
- Coastal & elevation drops: Houses situated just three blocks off a coast, or down in a valley versus on a ridge 100 feet away, experience vastly different wind profiles and thermal bounds.
- Micro-scale resolution: In our new microscale forecast layers (sub-kilometer spacing) temperature and wind parameters reflect localized terrain — down to showing the wind speed on a golf course tee box.
With the exception of the microscale forecast, traditional single-point lookups blur these geographic details. Full tile processing gives decision engines the complete spatial context needed to manage real risk across spread-out assets.
10+ years of spatial intelligence
Spatial intelligence isn’t just about the present forecast — it’s about historical analysis, auditing, and storytelling.
SSDS now exposes an extensive catalog of over 2,000 gridded and vector products, backed by 10+ years of continuous historical source data:
- Dynamic tiling on demand: By pointing our Dynamic Tiler at deep S3 archives, SSDS dynamically generates tile pyramids from historical source files on the fly. Media outlets, researchers, or insurers can visualize 10+ years of temperature evolution or hail footprint trends without heavy manual preprocessing.
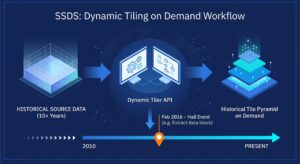
- 90-day operational replays: Flight operations are often required to audit decisions after severe weather events. Our Historical API allows planners to perform a full step-by-step replay of exact radar conditions, wind vectors, and icing layers as they appeared to dispatchers in real time
Unlocking the 2,000-layer catalog
Ask most people what layers are on a weather map, and they’ll list six or eight: radar, satellite, clouds, and surface temperature. What many enterprise teams don’t realize is that The Weather Company SSDS hosts an API catalog of over 2,000 spatial data products — from 1,400 gridded layers to hundreds of vector datasets covering water temperatures, lightning strikes, and atmospheric parameters.
Exposing the world’s best weather science via API
At its core, SSDS is designed around a single mandate: Take the unmatched scientific depth of The Weather Company — our global forecasting models, proprietary radar blends, AI models, and meteorologist expertise — and make it accessible in whatever dimension our customers need.
T
API calls per month
K+
weather stations worldwide, including over 100 weather models, radar, satellite, and lightning data
%
uptime SLA
Whether your operations require 2D visual maps, 3D trajectory sampling across flight levels, automated polygon extraction, or historical event replays, SSDS delivers that intelligence rapidly, efficiently, and at global scale.
Get started
Contact our experts today to discover how Weather Data APIs can empower your decision-making and strengthen your business resilience. Let us help you transform weather data into a strategic asset.
Contact us