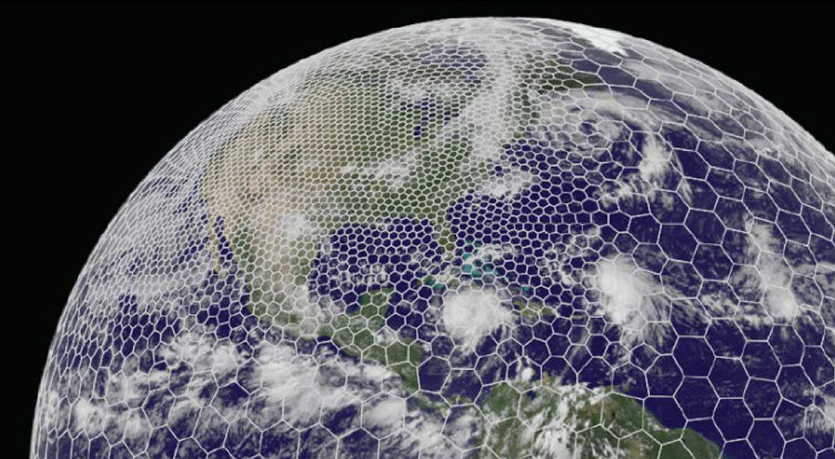
The latest GRAF® weather model improvements
Continue reading

Key takeaways
- Single-source feeds create blind spots in certain areas, while pure satellite imagery captures upper-atmosphere cloud tops rather than actual surface precipitation.
- Precise weather radar visualization requires stitching together multi-angle ground radar, high-resolution satellite cross-referencing, and proprietary physics modeling like the GRAF® model.
- Advanced predictive modeling is continuously monitored and quality-controlled by an expert meteorological team to prevent model hallucination and ensure decision-grade reliability.
Whether planning a commute or managing enterprise risk, we trust weather radar to show us what’s actually happening. But all weather visualizations are not created equal.
If you open different weather applications during the same active weather event, side-by-side comparisons reveal stark differences in resolution, clarity, and structural accuracy. Where one platform shows a distinct, localized rainband, another might display a spotty, low-resolution mass of color that bears little resemblance to the reality on the ground.
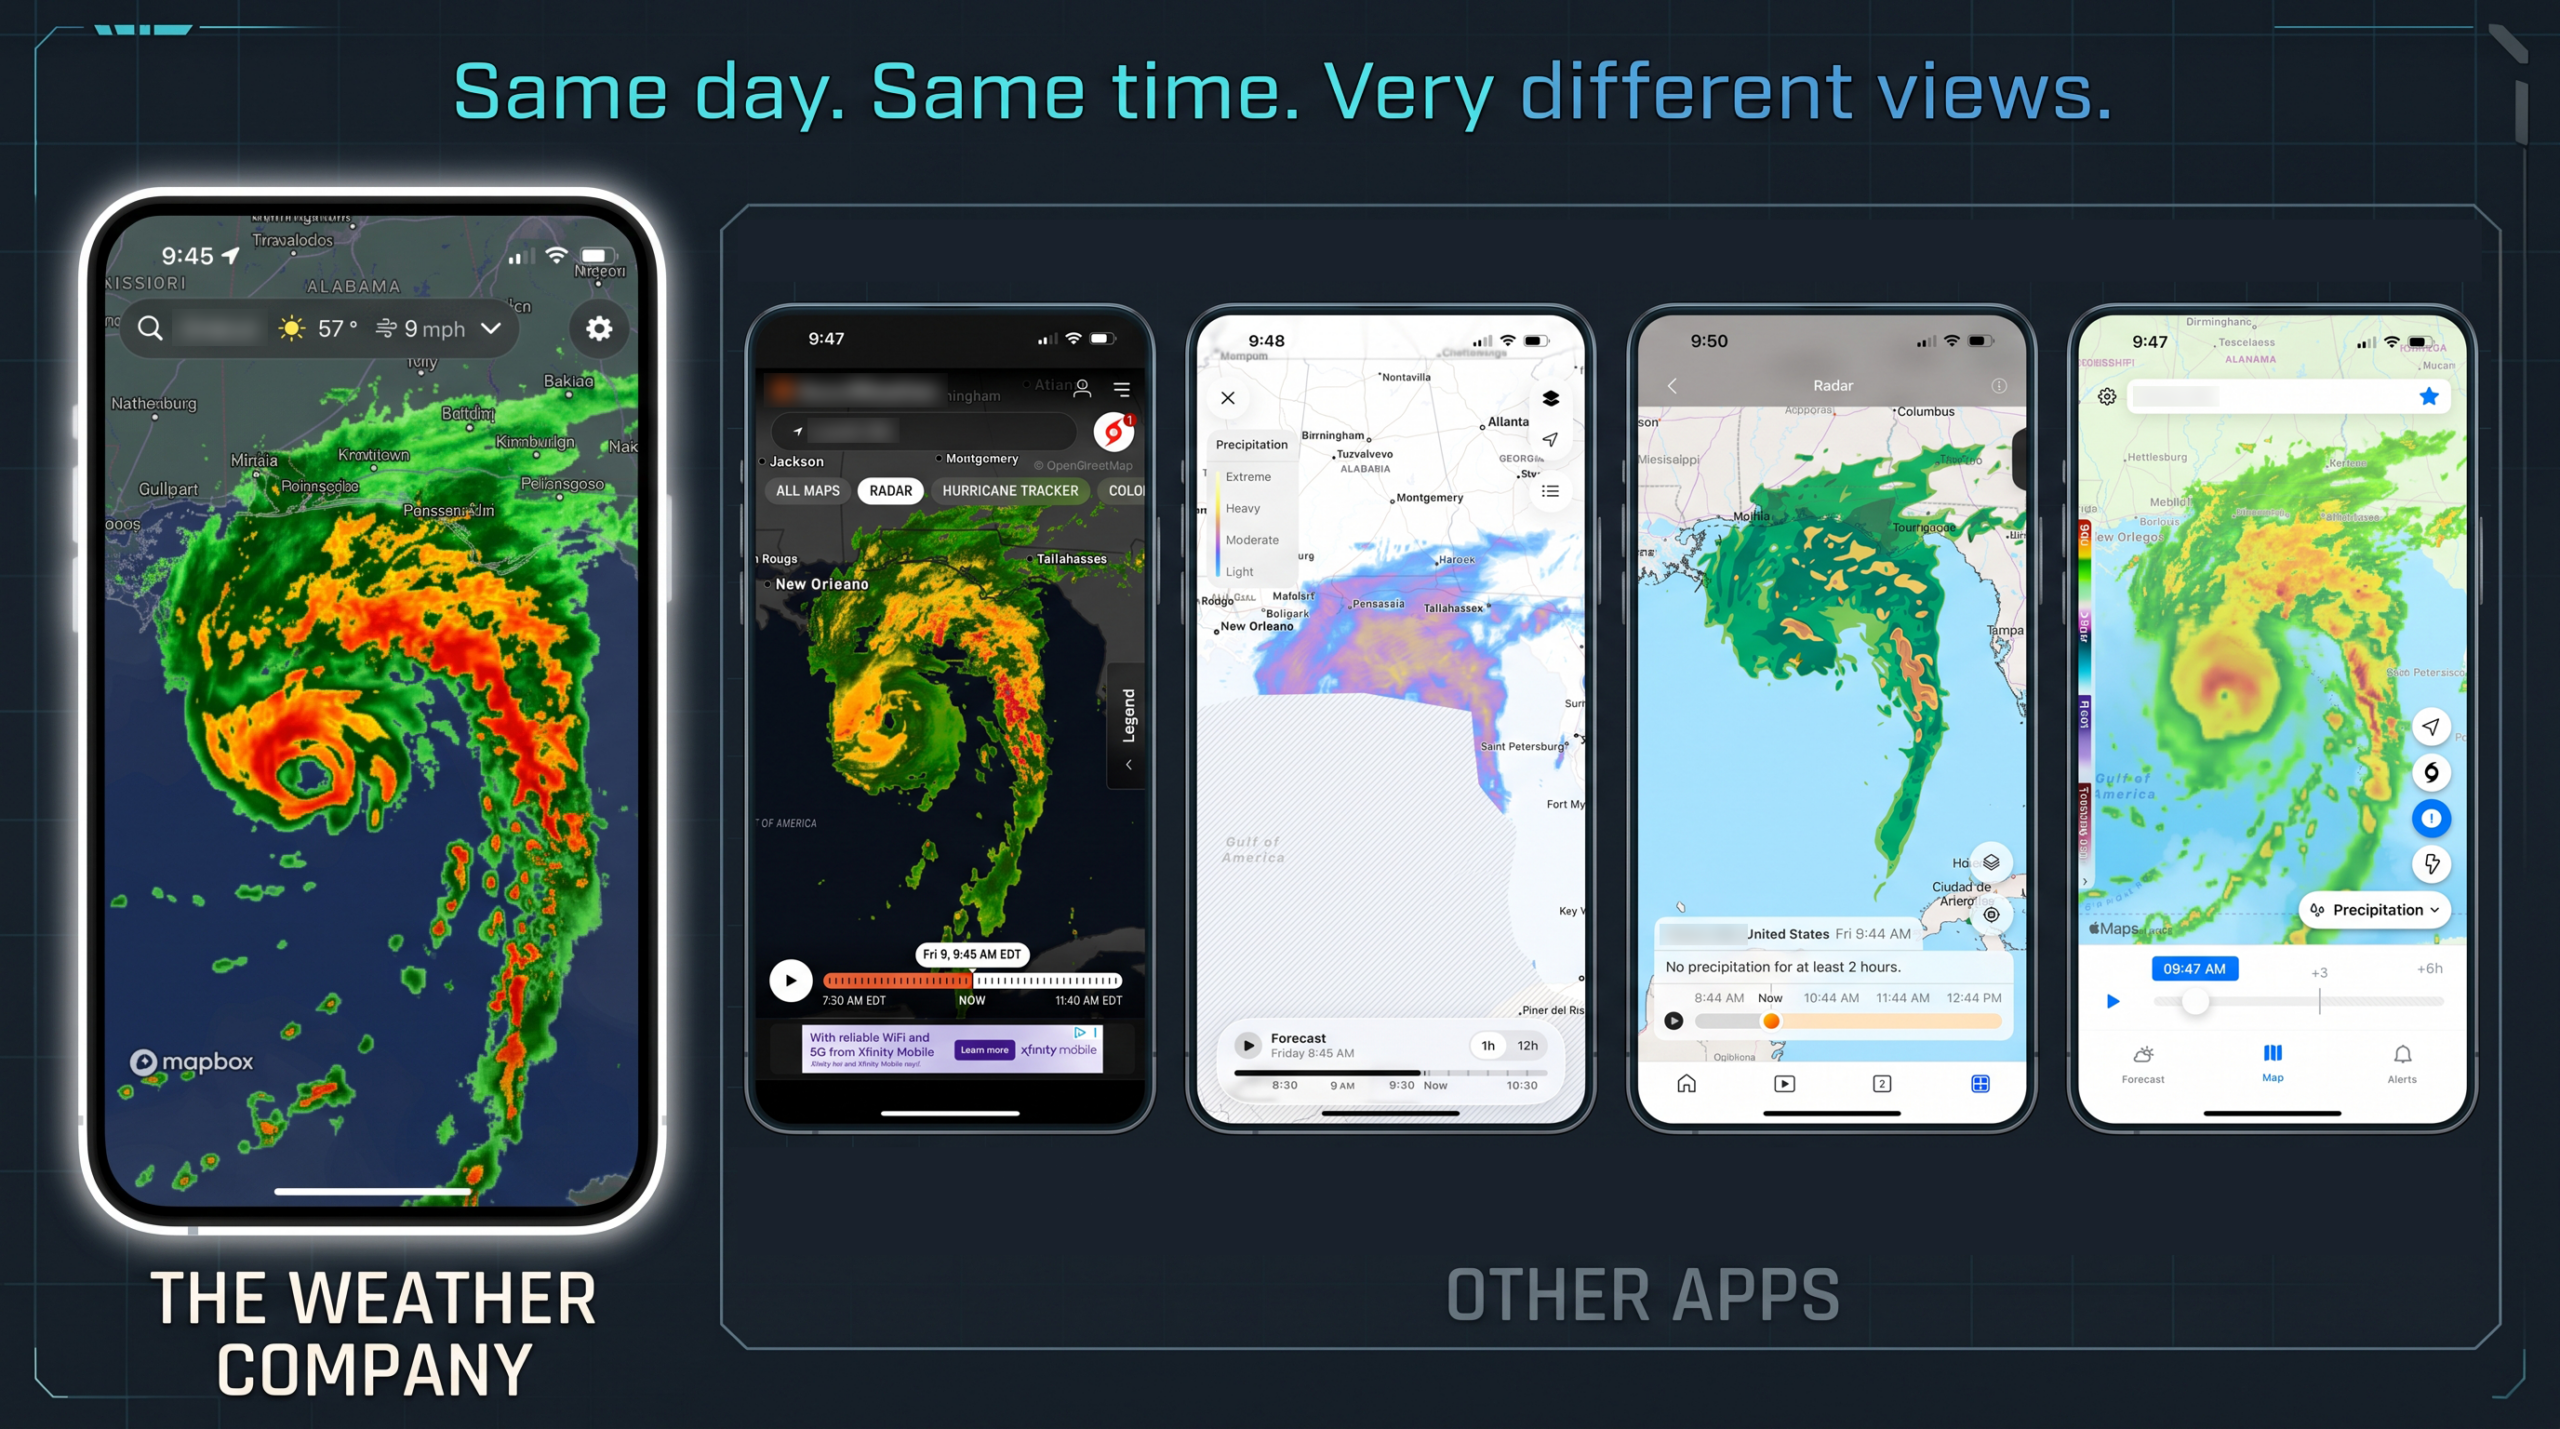
A side-by-side comparison shows how different platforms represent the same storm event, ranging from our multi-angle representation to blurred cloud-top overlays to missing radar coverage. All images taken 10/9/2026, between 9:45 and 9:50am ET, of Hurricane Isaias
Why is the gap between forecasting platforms so wide? The issue lies in a fundamental technical shortcut: most providers rely on incomplete, single-source data streams to drive their radar map representation.
The flaw of single-source radar views
To understand why competitor forecasts degrade, you first have to look at how weather imagery is constructed:
- Horizontal axis: Radar-only representations leave regional blind spots. Ground-based radar stations are great at measuring local precipitation, but they don’t exist everywhere. Ground radar coverage naturally thins out or disappears completely over oceans, mountainous terrain, and rural or under-instrumented regions.
- Vertical axis: Satellite-only representations can’t see what’s under the top layer of clouds. To solve coverage gaps, many applications default to pure satellite imagery converted into a radar-like display. But satellites primarily observe what is happening at the top of the clouds in the upper atmosphere, not what is actually reaching the ground. Treating cloud-top views as surface precipitation results in “ghost storms”, showing rain where none is actually falling at ground level.
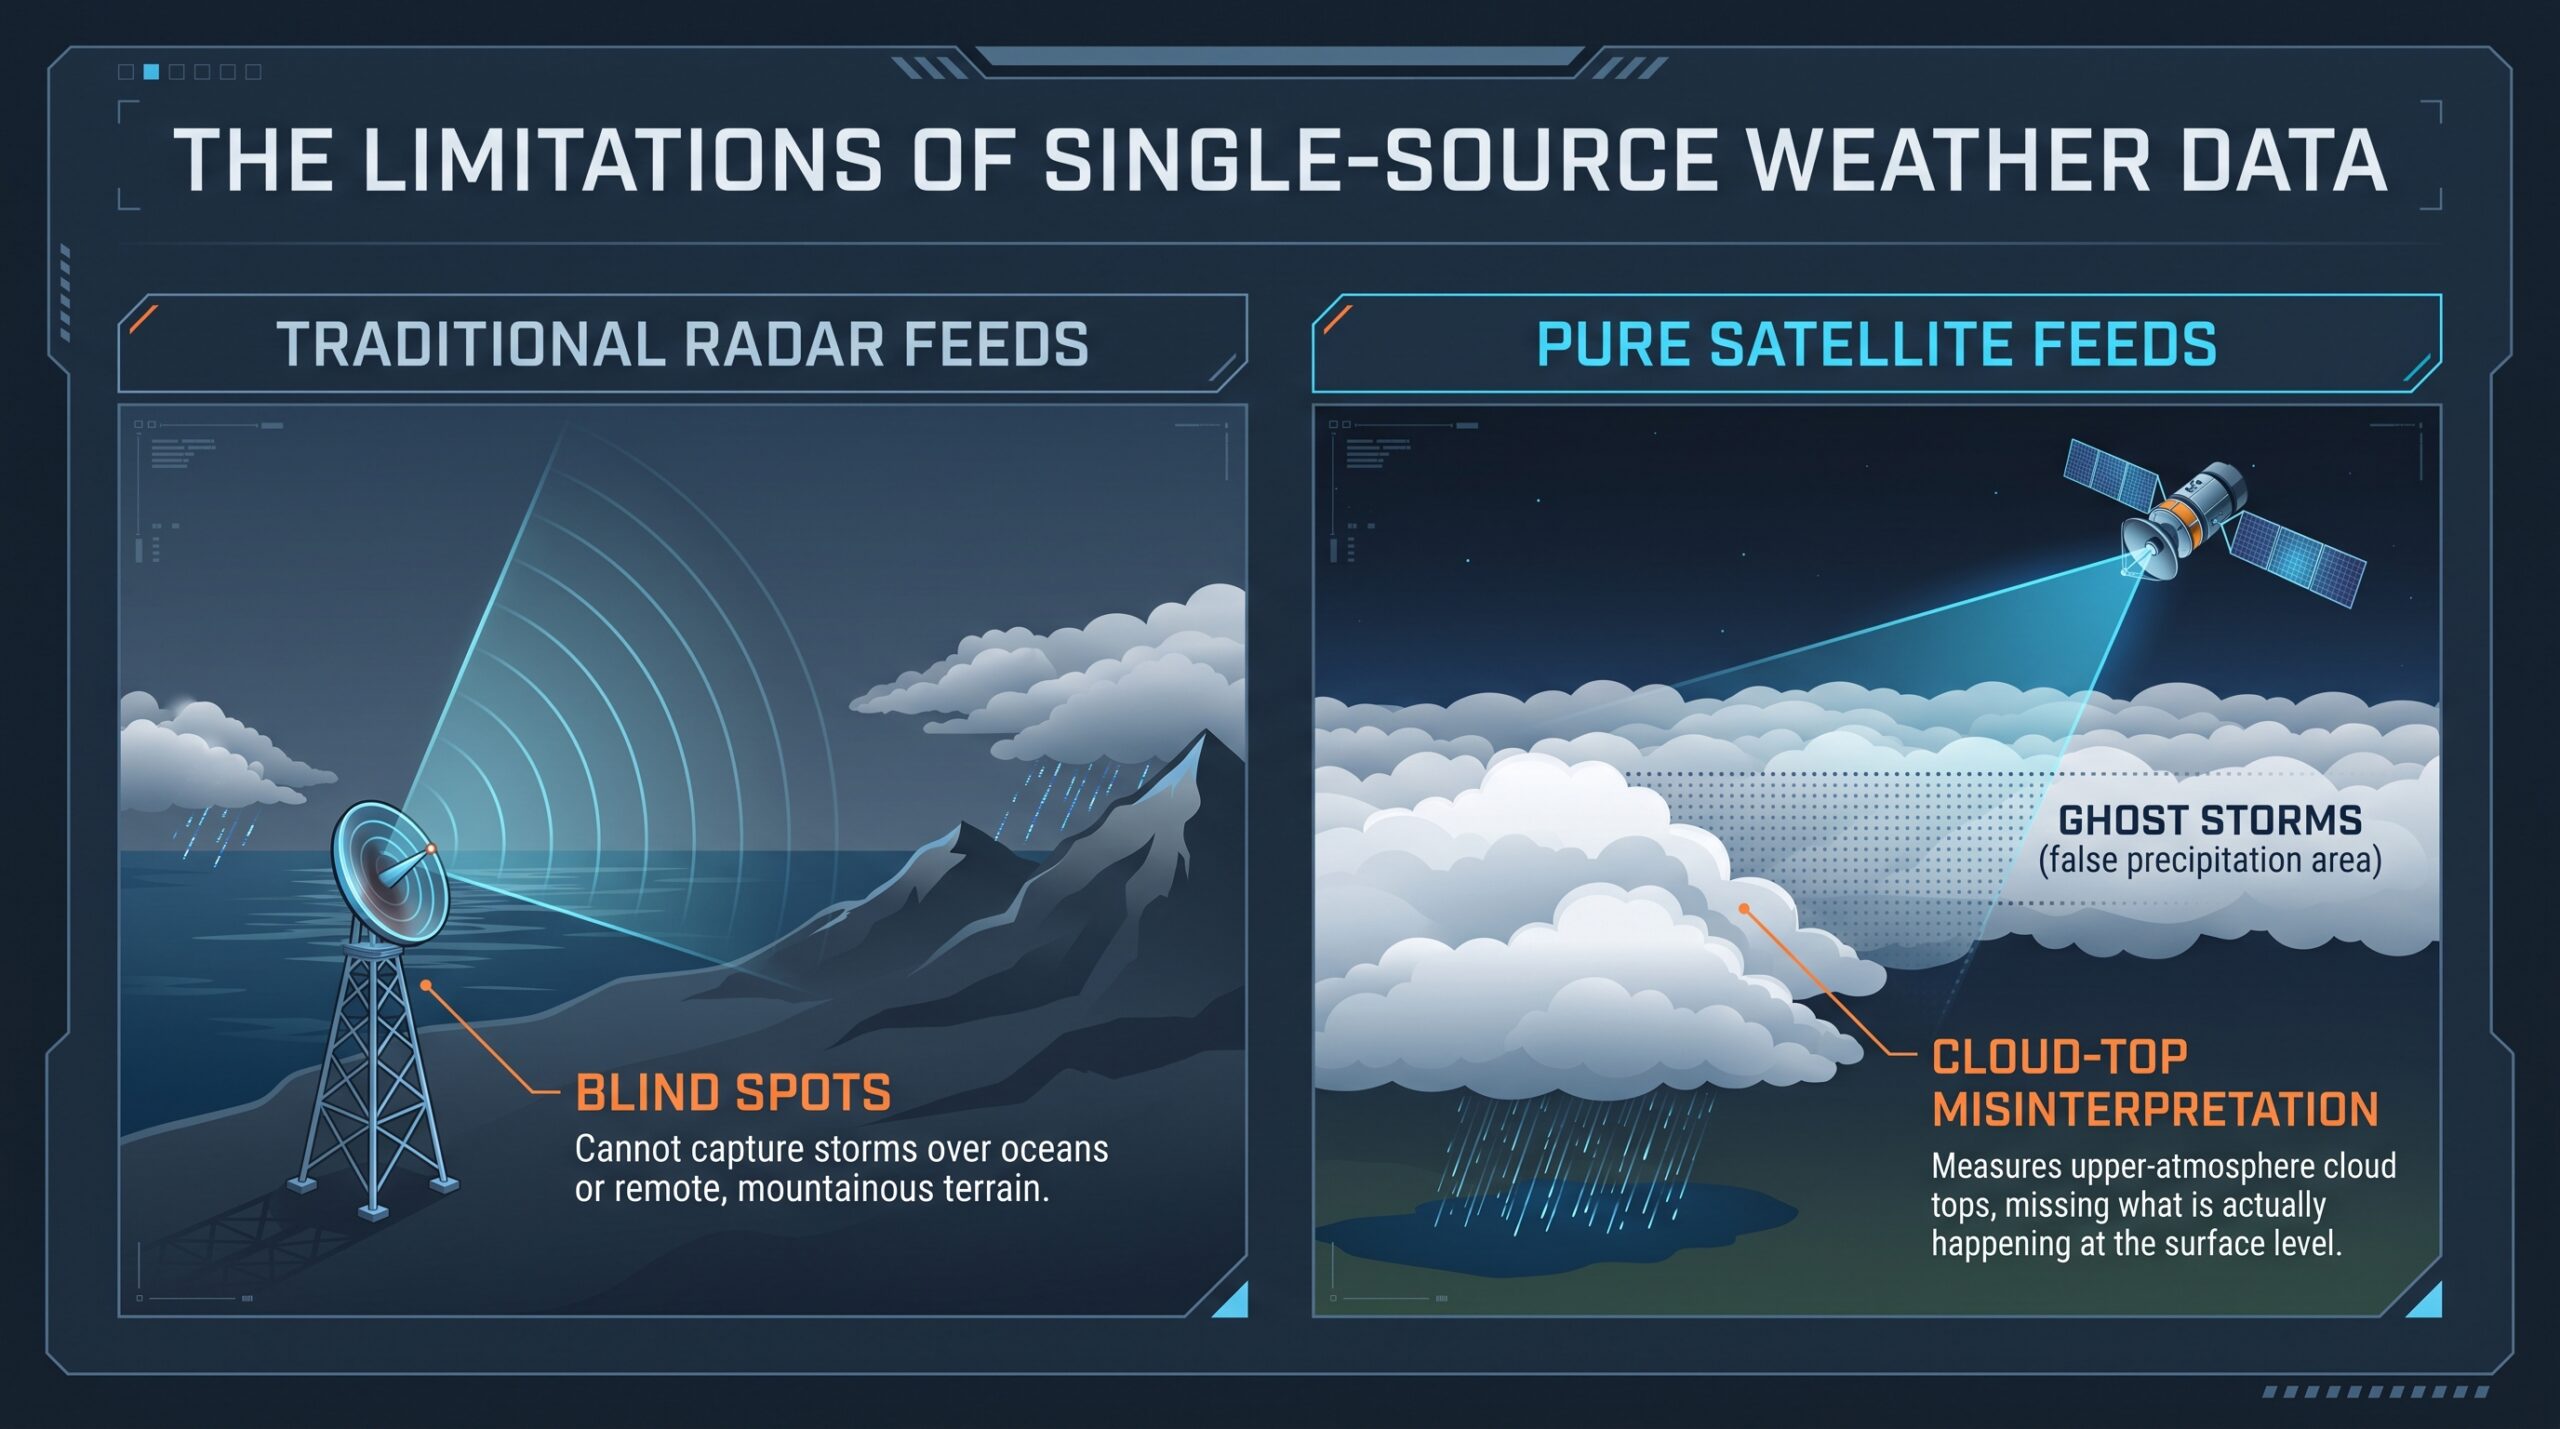
Precise visualizations require stitching together multi-source weather data from varying observational angles to reconstruct a true, multi-layered picture of what’s happening across the region and at all altitudes.
The high cost of low-resolution data for enterprise operations
For enterprise leaders, bad weather visualizations can be a major operational liability. When a platform misrepresents a storm’s intensity or location due to low-resolution “blobbing” or satellite “ghost storms,” organizations face two costly outcomes:
- False alarms that needlessly delay flights, stall supply chains, and halt outdoor operations.
- Unflagged severe weather that leaves on-site teams and equipment unprotected.
When millions of dollars in logistics, safety, and asset management depend on precise timing, relying on low-fidelity radar feeds exposes businesses to unnecessary risk and compounding financial losses.
The multi-layered picture: Combining radar, satellite, and GRAF®
To deliver an accurate representation of what is happening right now and in the hours to come, our forecasting engine integrates three distinct layers:
- Single-site ground radar integration: Rather than relying on low-resolution pre-blended mosaics, we pull data from individual single-site ground radars. By taking readings from multiple angles and locations, we stitch together a high-resolution, multi-angle baseline.
- Satellite cross-referencing: Instead of assuming all cloud coverage equals rain, satellite observations are cross-referenced against atmospheric profile data to isolate active precipitation cores.
- High-resolution modeling: To seamlessly bridge gaps where ground radar is absent, we fold in our proprietary Global High-Resolution Atmospheric Forecasting (GRAF) model.
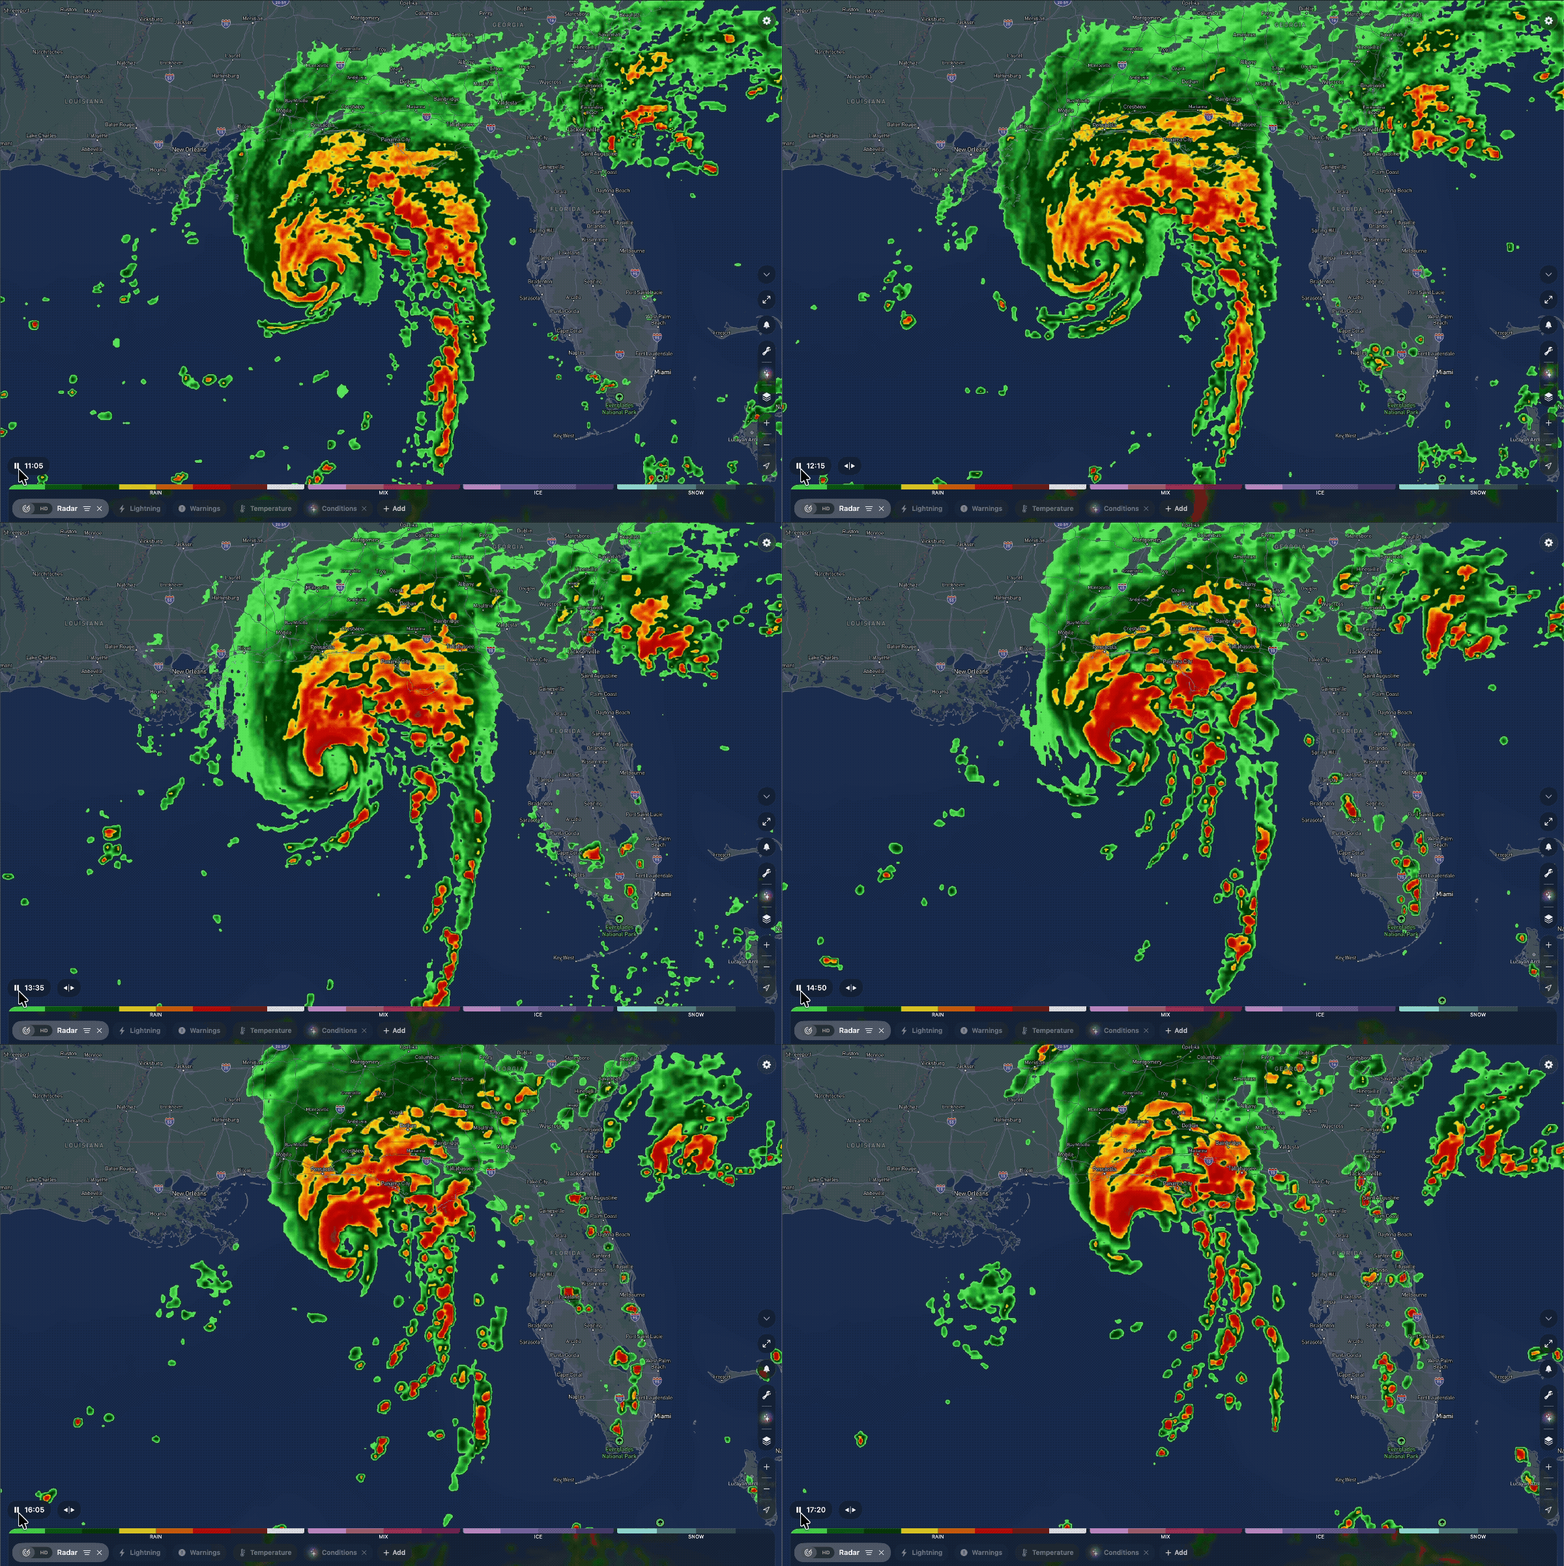

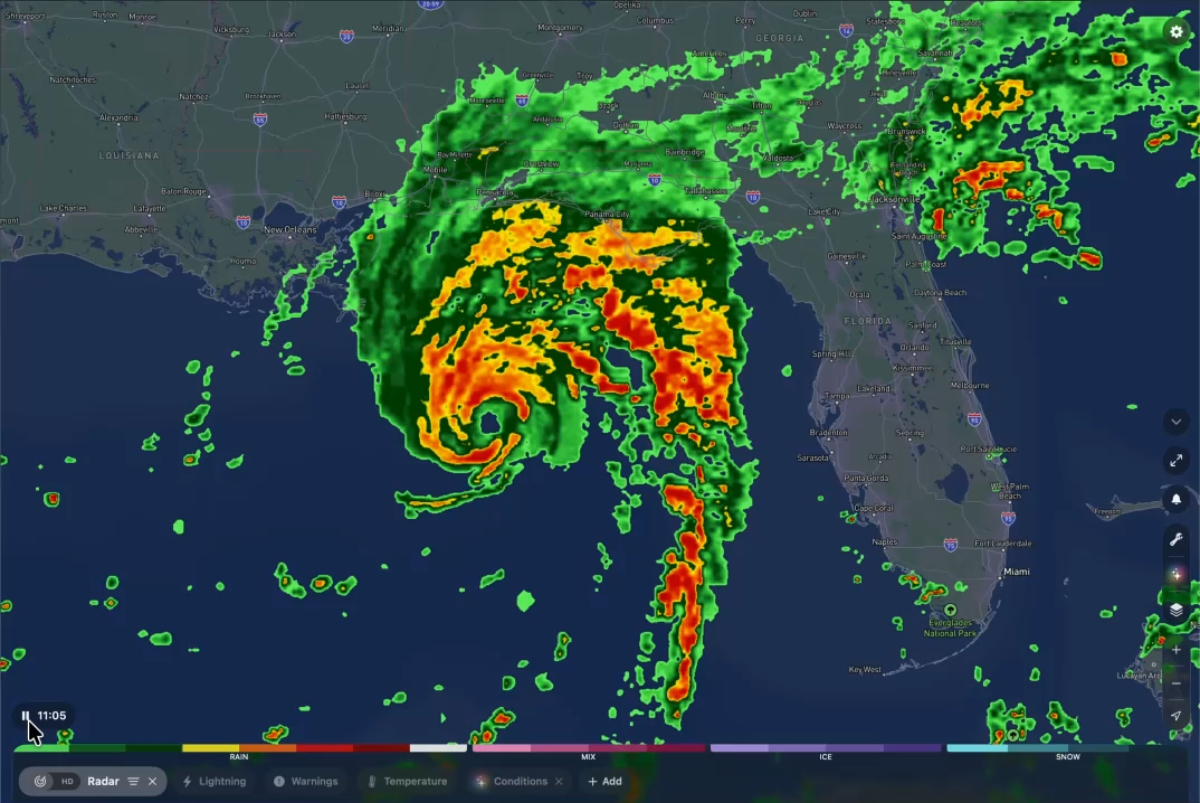
The Weather Company’s high-resolution radar rendering in action, tracking fine-scale atmospheric movement with crisp, surface-level precision.
Updated hourly with fresh data and fine-grained time steps, GRAF combines initial atmospheric observations with tuned physical equations to deliver a smooth, high-fidelity transition from current radar views into future forecast horizons.
| Feature / Source | Satellite-only representation | Standard radar mosaics | GRAF-powered approach |
| Surface precision | Low (cloud tops only) | Medium (coverage gaps) | High (surface-level validation) |
| Ocean & offshore coverage | High (unvalidated cloud imagery) | None (Blind spots) | High (GRAF + Satellite synthesis) |
| Forecast longevity (+3 hours) | Rapid degradation / smearing | Fades quickly beyond short-range | Sustained structural fidelity |
The longevity gap: Why predictions fall apart after hour one
It is one thing to render a snapshot of current conditions; it is another to accurately predict where a storm cell will be two or three hours into the future.
Many newer entrants in the weather space rely heavily on standalone AI models layered on top of simplistic or incomplete data streams. While AI is a powerful accelerator and is contributing to forecasting methodologies in an increasingly impactful way, applying artificial intelligence to inferior underlying data causes forecast images to break down rapidly—often within just an hour or two. Storm structures smear, storm intensity becomes distorted, and predictive value plummets.
Our GRAF weather model maintains structural clarity and spatial precision hour after hour because it is grounded in decades of meteorological modeling expertise and physical principles. Innovation isn’t just about applying the newest AI trend; it’s knowing which data inputs to trust and how to properly constrain predictive models with real atmospheric physics.
The human element: 24/7 quality control
Even the most sophisticated automated models require real-world validation.
Behind our high-resolution radar and forecast models sits our Meteorological Operations (Met Ops) team—expert meteorologists working 24/7/365 to continuously monitor, validate, and quality-control radar feeds, GRAF outputs, and satellite data in real time.
In an era where unverified model outputs can lead to false alarms or missed threats, having human meteorological oversight ensures that the insights you rely on are verified, consistent, and dependable when decisions matter most.
Science-forward precision you can rely on
Whether you are tracking an approaching convective storm line or evaluating regional weather impacts across enterprise assets, precision starts with sound science, multi-source data integration, and continuous validation.
Don’t settle for cloud-top guesses or low-resolution approximations.