The latest GRAF® weather model improvements
Continue reading

What are weather graphics?
Weather graphics are an essential component of helping forecasters communicate to viewers what’s happening next. These visual tools provide a clear way to communicate local, state-wide, or even nationwide forecasts.
better illustrate a forecast. They can also be used on television and mobile devices, or combined with other data sets, such as traffic data, to provide more value to users. With about 60% of viewers stating that the weather segment is a major reason to watch a newscast, according to Magrid and The Weather Company, your weather broadcasts need to stand out. By using this feature, you can provide a robust visual representation of the weather that keeps users educated and engaged.
How do weather graphics work?
Data first and foremost inform weather graphics. Typically, a computer processing system combines data from available tools, such as weather radar, into a graphical interface that forecasters then use to analyze the data. From there, users prepare and issue weather forecasts, watches, severe weather warnings, and more.
Additionally, weather graphics can be used to tell a story or complement it. Oftentimes, meteorologists piece together their story well before it makes it to air, and during this time, meteorologists select the TV weather graphics that best help tell that story. As technology continues to evolve, we can expect meteorologists to increasingly use 3D elements and other intriguing graphics to distinguish themselves from competitors, keep users engaged, and drive loyalty.
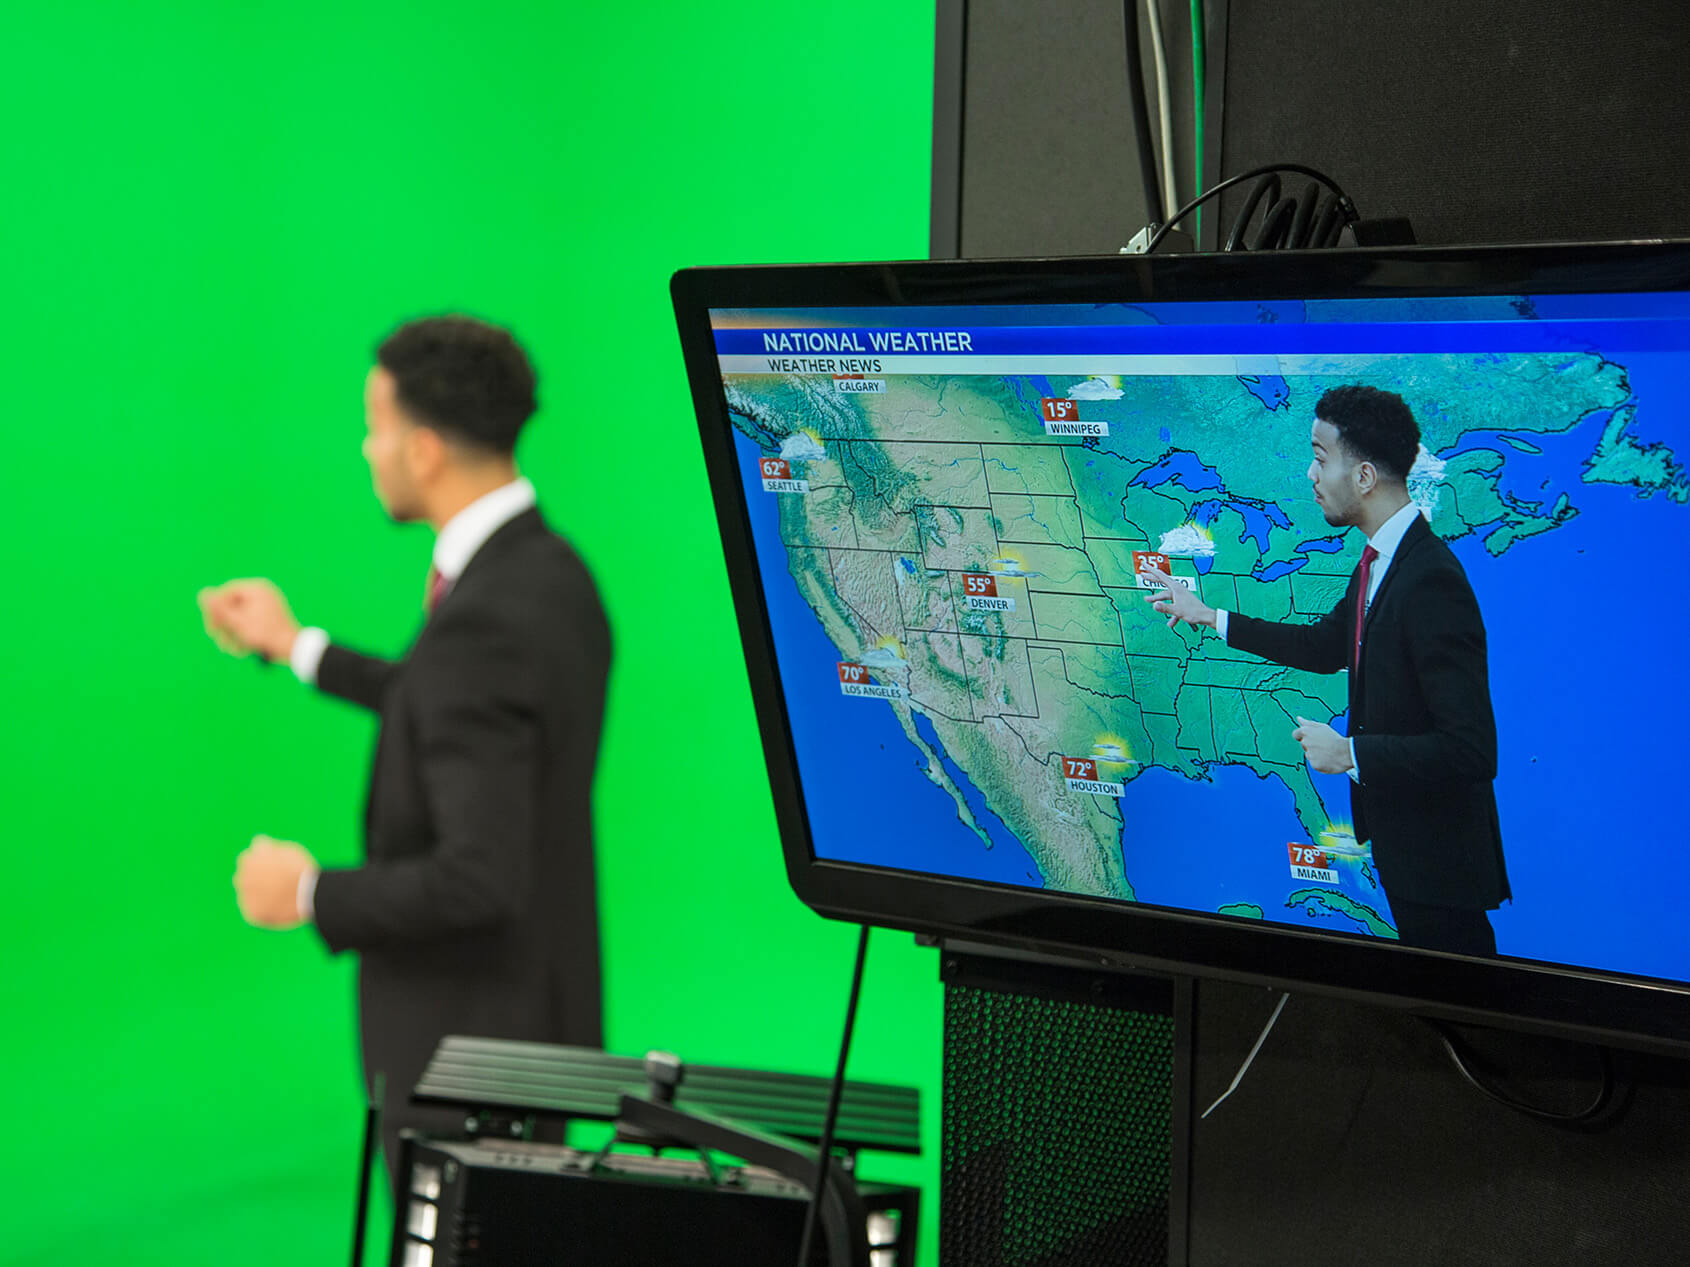
Using weather graphics in television
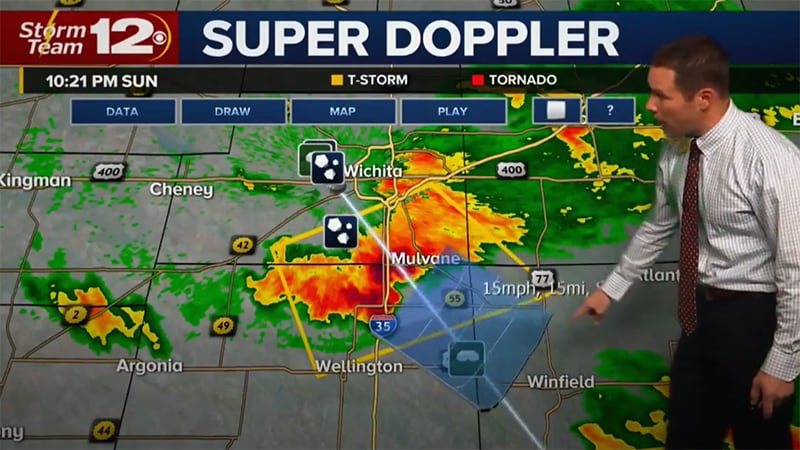
TV weather graphics use accurate, near-real-time data to present the weather forecast visually. These graphics allow meteorologists to tell a compelling weather story to help viewers understand the impact it might have on traffic or the weekend. These visuals can also help prepare viewers for heavy precipitation or severe weather.
Breaking down the basics of weather graphics
A good weather graphic is defined by how easily it can be interpreted. If viewers don’t resonate with your weather forecast, they may switch to another station. According to Magrid Research, while most viewers prefer meteorologists in weather broadcasts, 42% of viewers prefer data/graphics as they bring a level of simplicity, straightforwardness and reduce chit-chat. That’s why it’s so important to use weather graphics that are not only engaging but easy to understand by your audience. To break it down, a graphical weather forecast should:
- Convey the information in a consumable, aesthetically pleasing manner.
- Help the meteorologist tell their story.
- Support the forecast with helpful information.
- Break down the forecast in the quickest and most effective way.
The different types of weather graphics
There are many ways to use weather graphics. Let’s look at the different types of graphics you can use.
1. General weather graphics
General TV weather graphics are often used to convey forecast information to viewers, whether at the local, state, or national level.
2. Chance of precipitation
These graphics help forecasters show rain, snow, sleet, or hail.
3. Temperature
Forecasters can show temperature data, whether at the local, state, or national level.
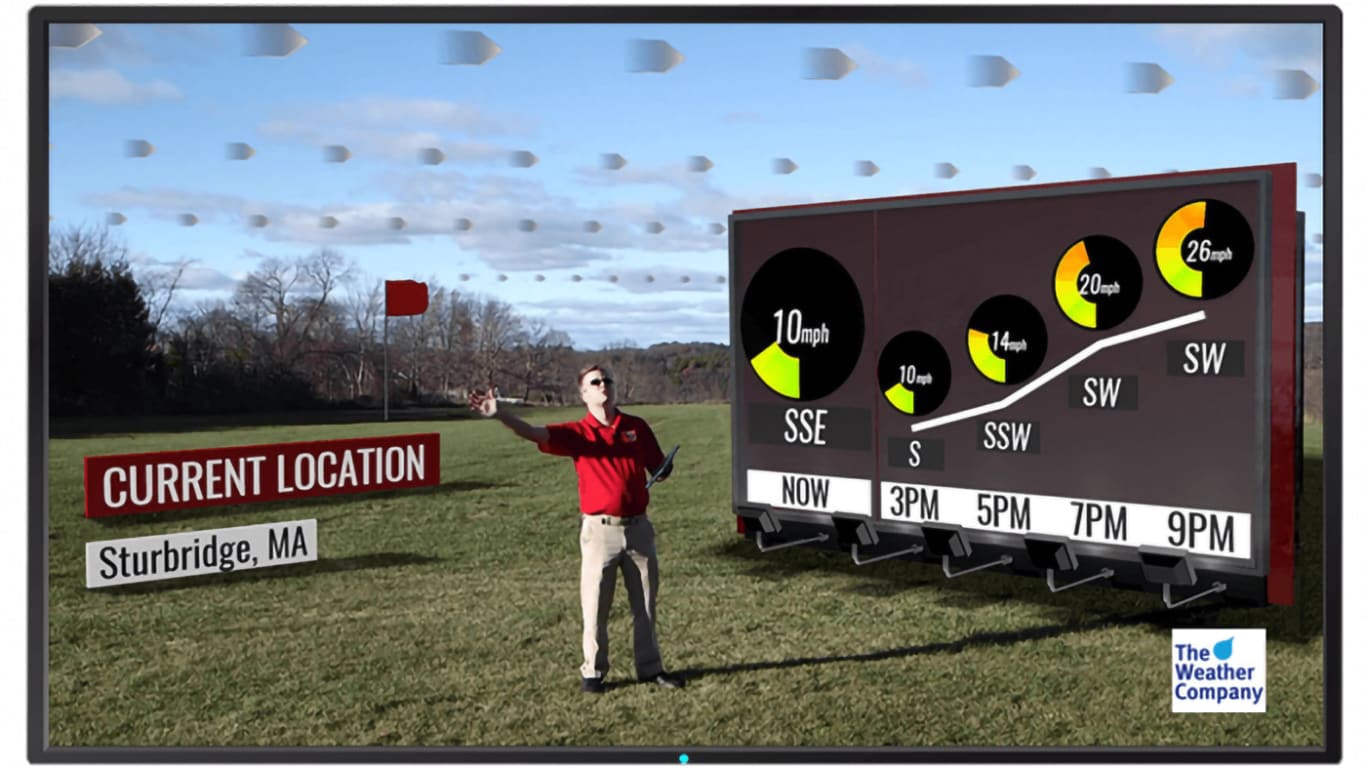
4. Wind speed and direction
These visuals help depict wind speed and direction at the local, state, and national levels.
5. Amount of precipitation
In addition to precipitation type and likelihood, weather graphics can show the amount that might fall in a particular area.
6. Sky cover
These graphics are typically helpful for airlines and others looking for an overview of flying conditions.
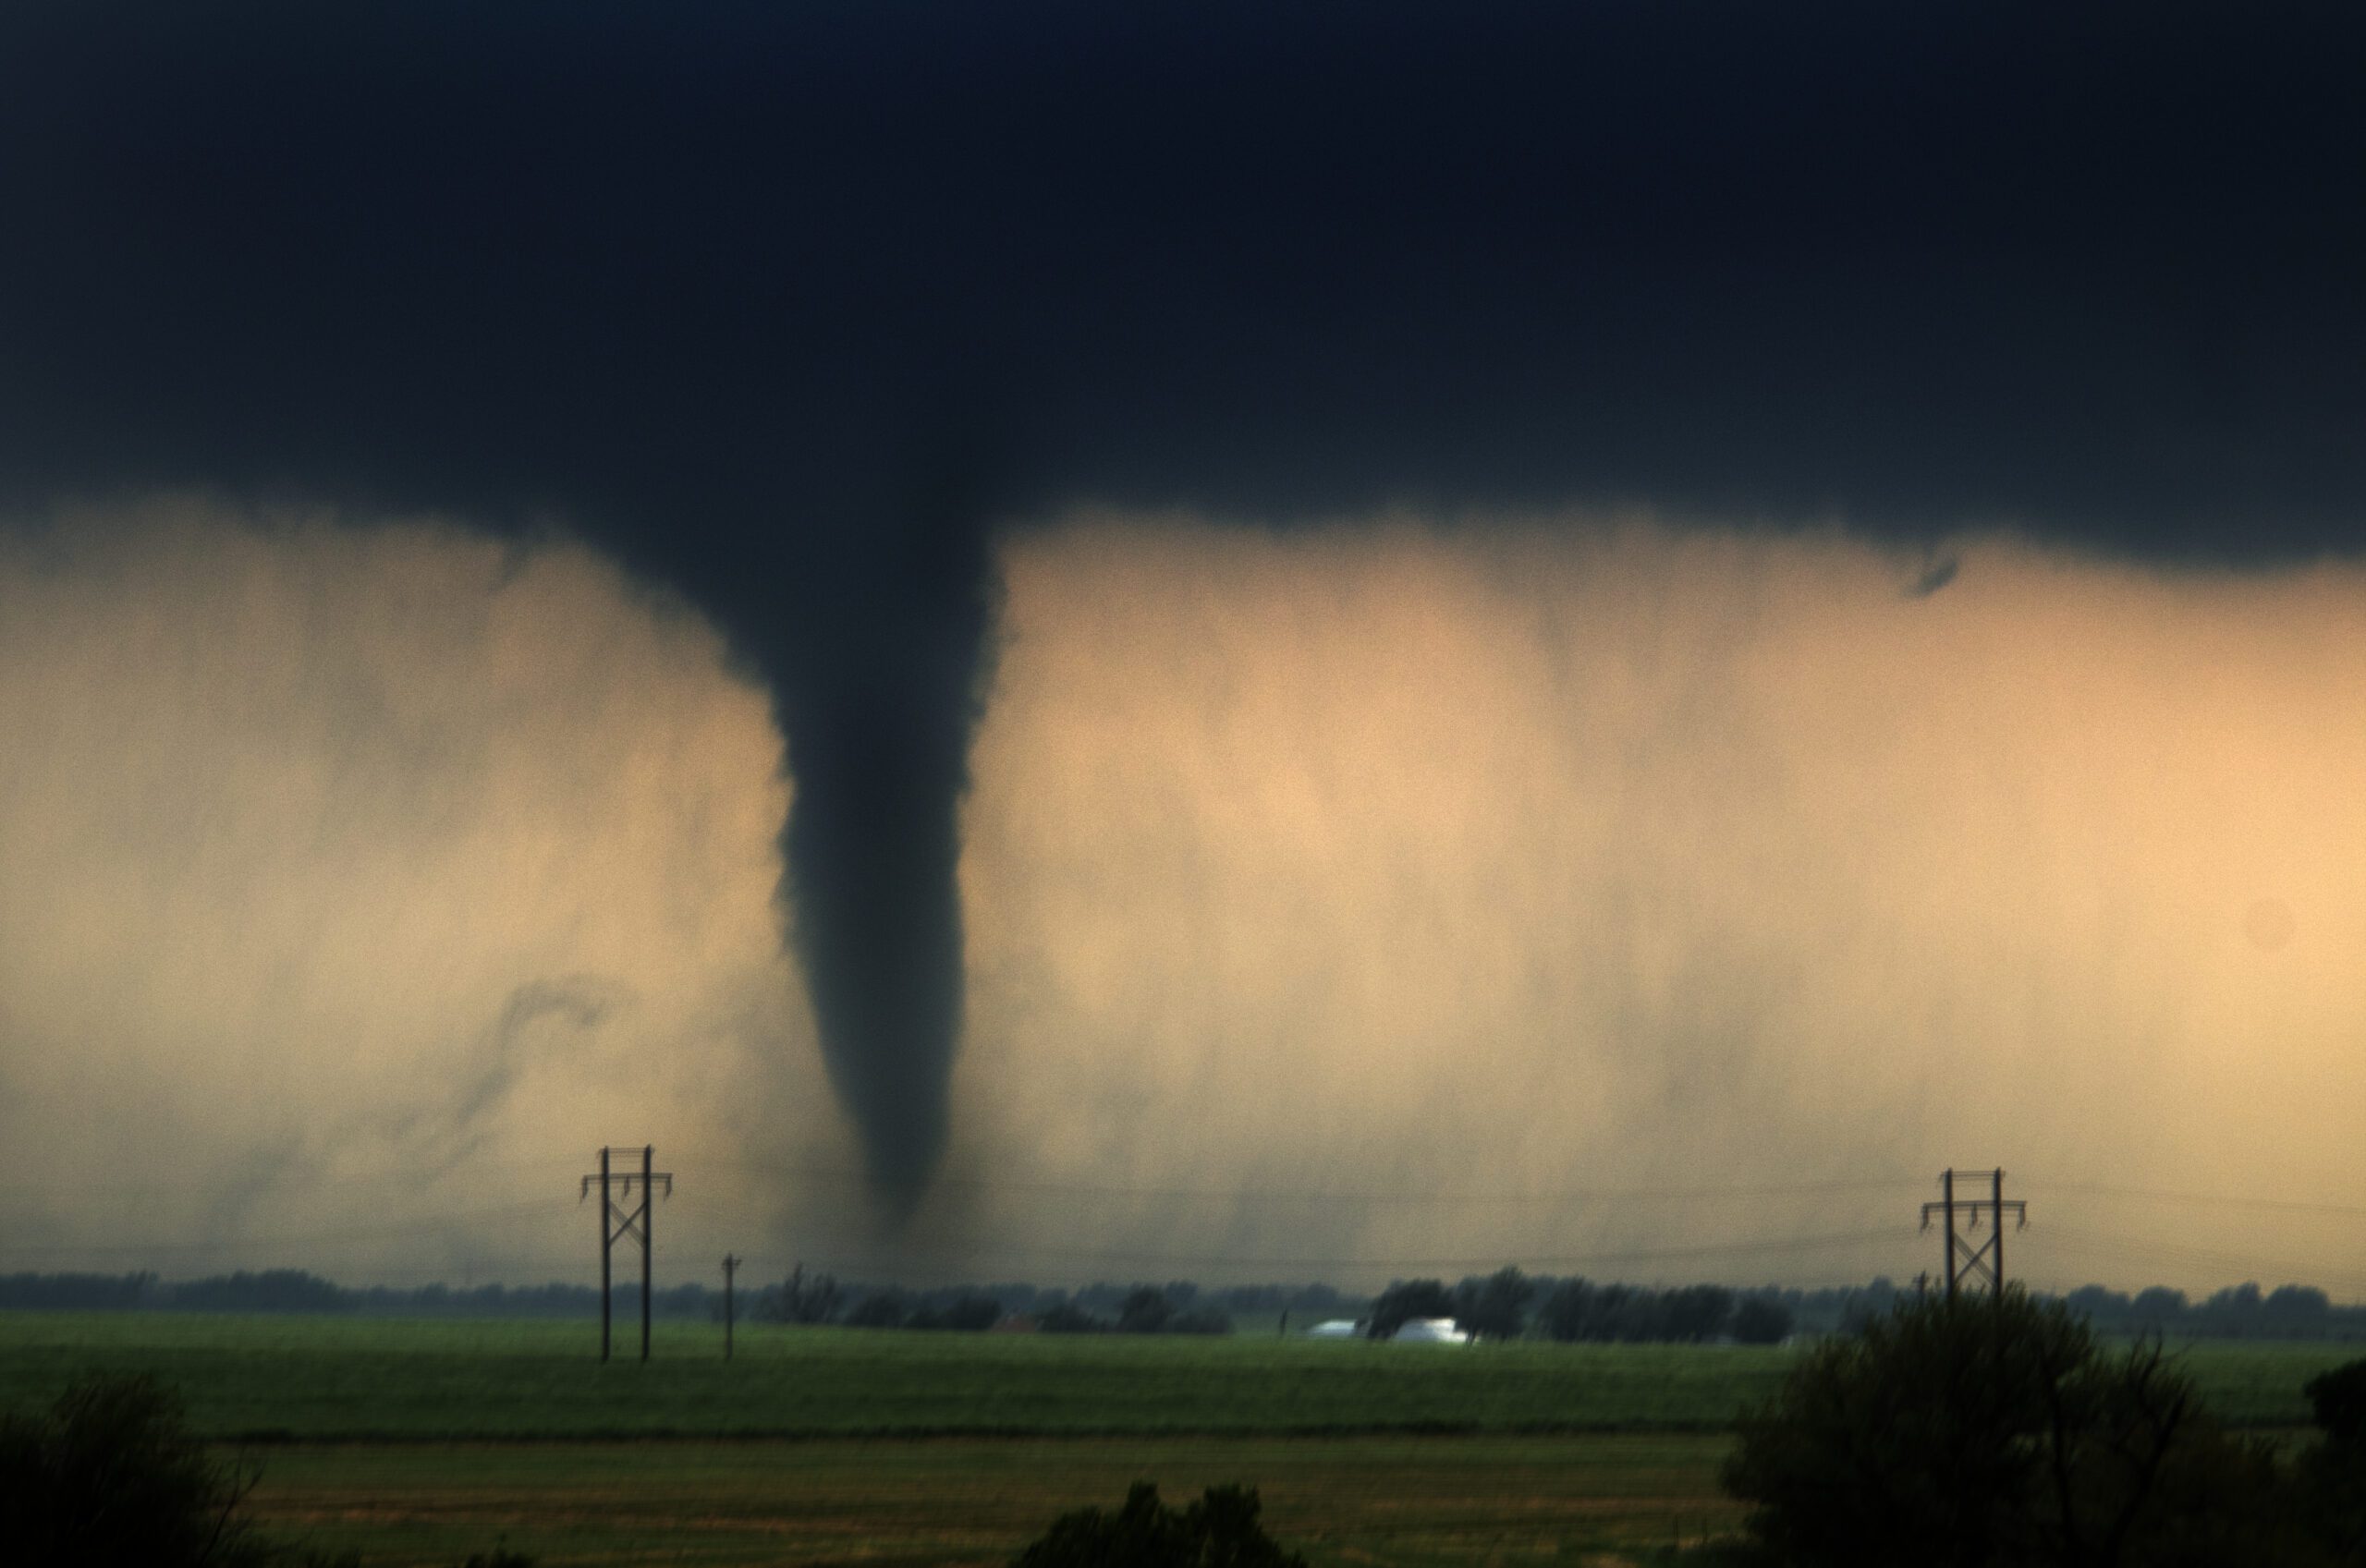
7. Severe weather forecasts
These visuals are used to report on forecasts that are severe in nature.
8. Lifestyle
These visuals are used to display everyday health-related conditions such as pollen levels, local air quality, and the allergy index. According to Magrid research, 49% of weather consumers are very interested in health-related news.
Graphical weather forecast technology
As mentioned, weather graphics have come a long way since their inception and have become increasingly advanced. Now, meteorologists can incorporate intriguing new elements into their broadcasts, like the following.
1. Augmented reality forecasts
Augmented reality forecasts can engage viewers and keep them watching longer. Plus, they can incorporate traffic data, which is doubly helpful for viewers.
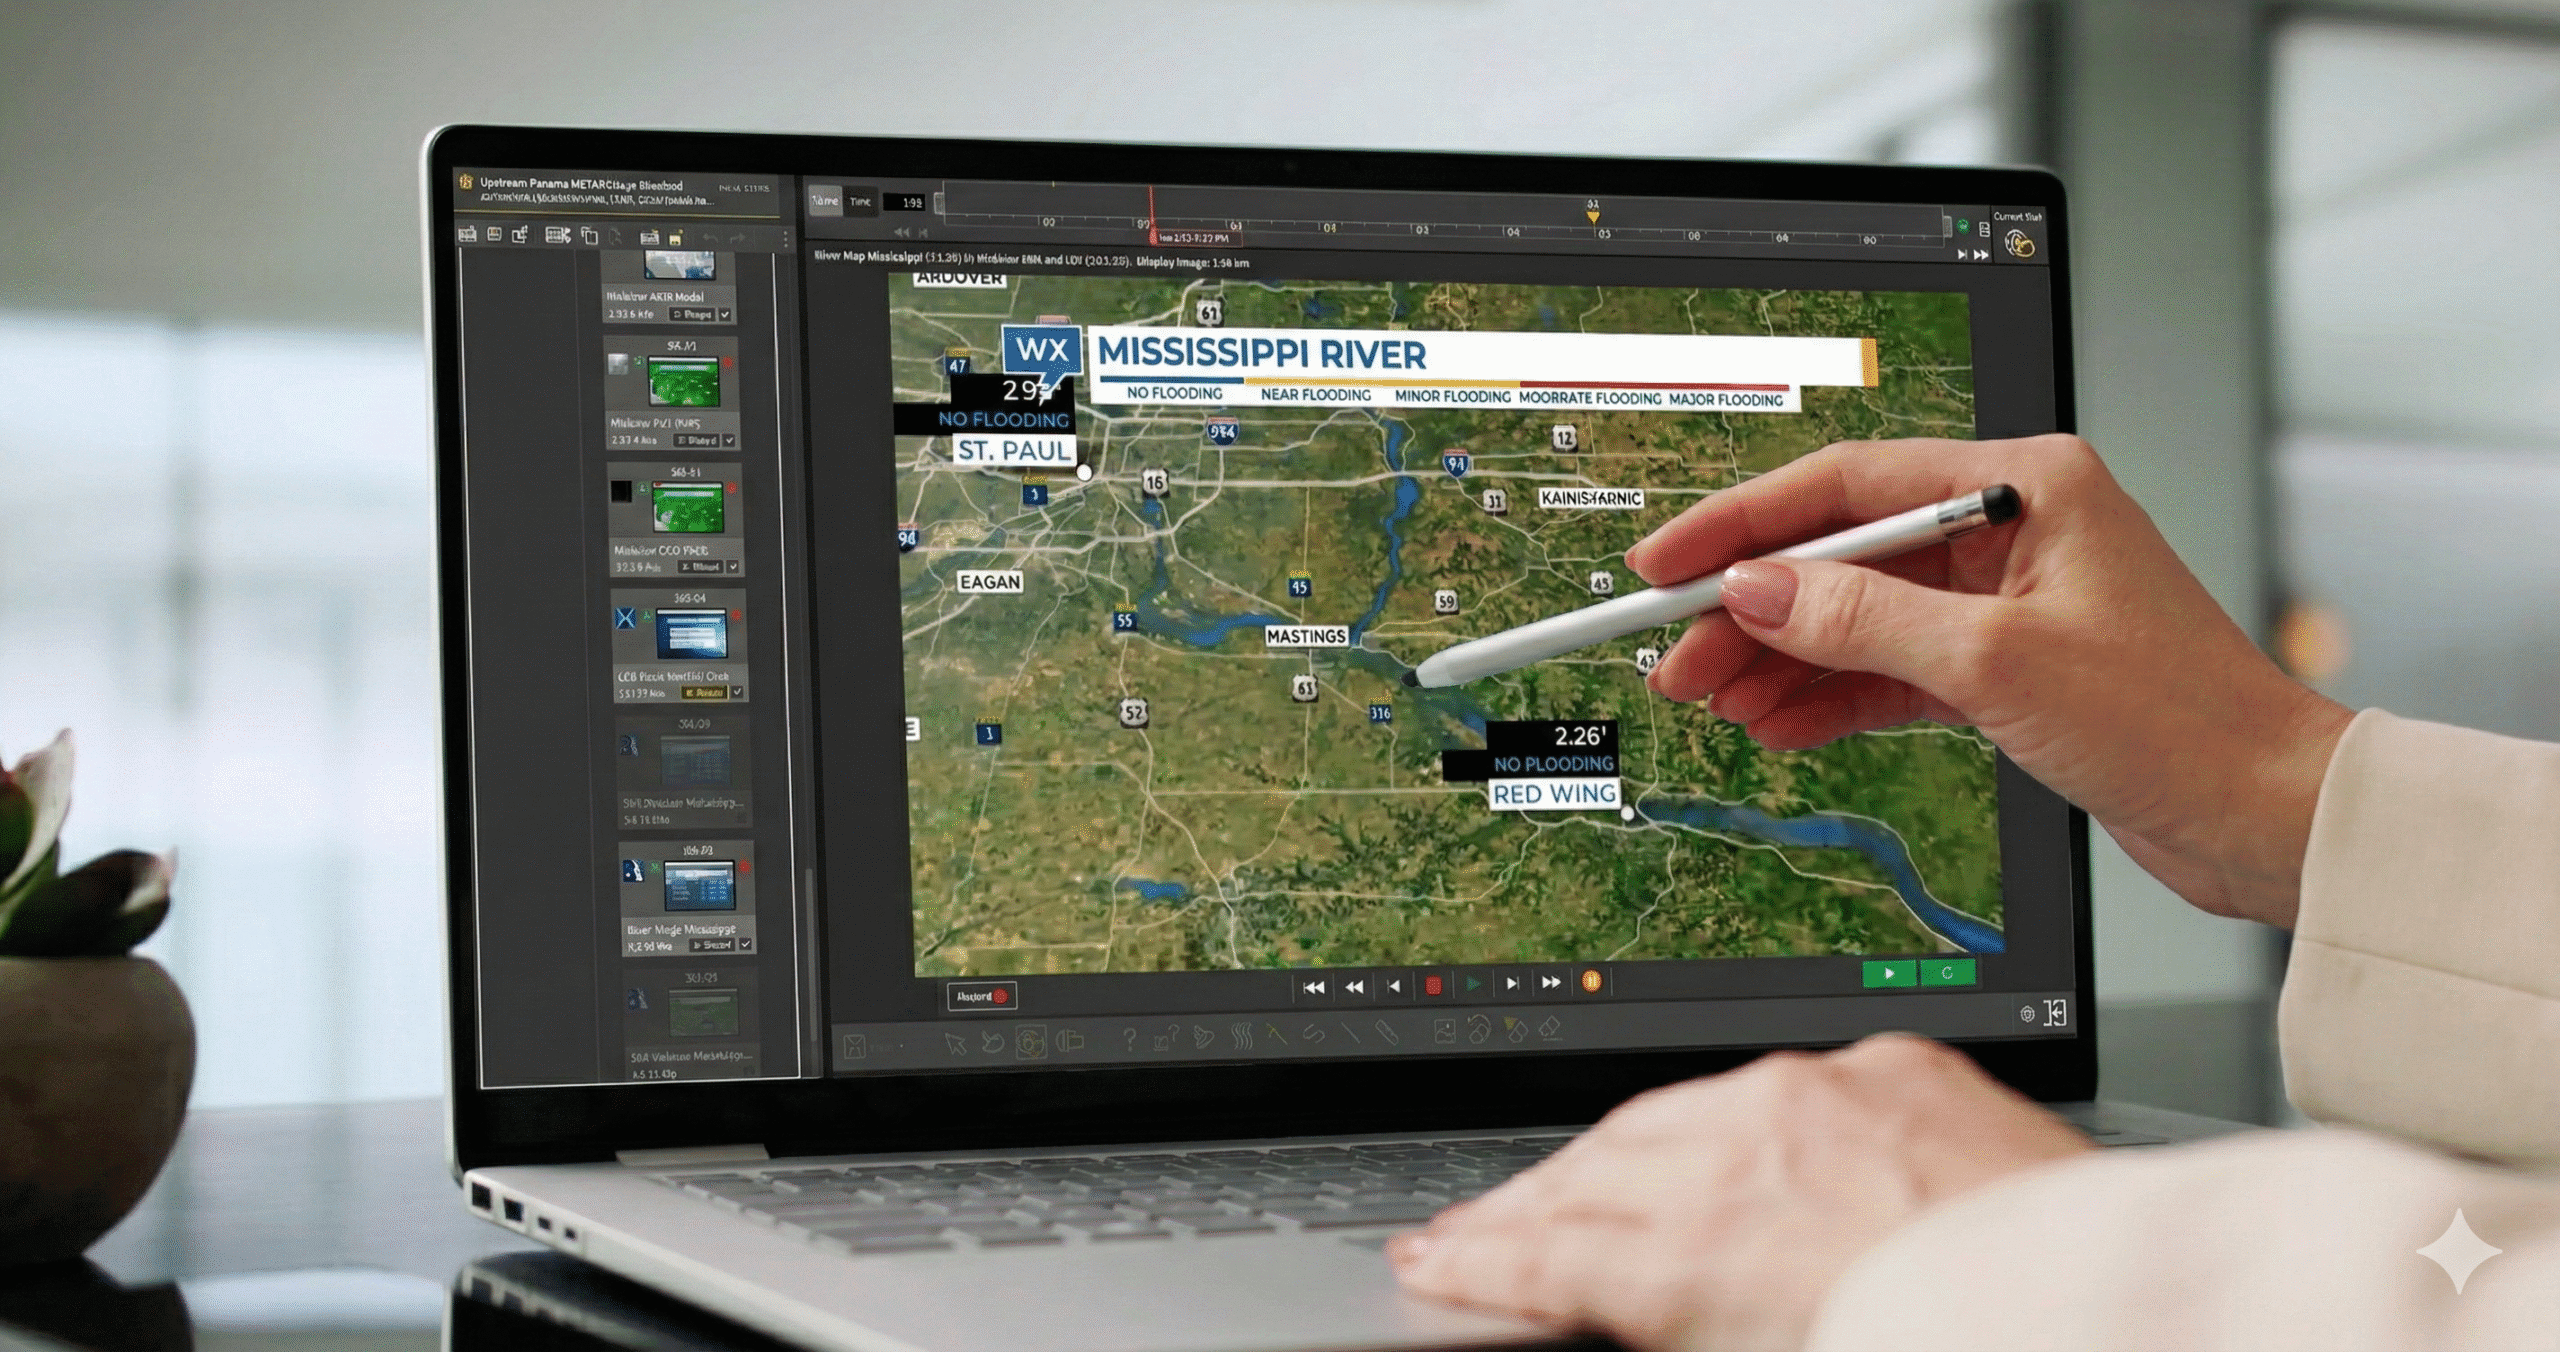
2. Data-driven forecasts
Data-driven properties (DDP) allow for unique, automated visuals over a multitude of weather parameters. DDP can help provide viewers with granular forecasts they can use to plan their days.
3. HD weather graphics
At a certain point, aesthetics do come into play. At The Weather Company, we have made HD weather graphics a priority to help meteorologists deliver crystal-clear broadcasts.
4. 3D weather forecasts
Bringing weather to life is an important way to keep your audience invested in your daily forecast. With 3D technology, your graphics will pop off the screen. These visuals can bring your television broadcast to life.
5. Interactive forecasts
Another way to engage viewers is through interactivity. Max users can switch between different views and tower cams, so viewers always have various points of interest to observe.
Benefits of weather graphics
Having the right weather graphics to put in front of viewers can pay off. Meteorologists benefit from a more engaged audience, while viewers gain a clearer understanding of the weather forecast. Let’s look at the benefits of having the right weather graphics.
1. Viewer engagement
The more engaging your weather graphics are, the more likely viewers are to return to your forecast. By using new and unique weather graphics, you keep viewers informed while entertaining them.
2. Loyalty
With that engagement comes loyalty. If your audience can count on you to produce quality content, they may be more likely to remain loyal to your station.
3. Credibility
Above all else, accuracy is key. Good, quality, and accurate weather forecasts boost your credibility. That’s why having forecasts that break down the weather hour by hour is so important to visualize, as they help viewers plan their days. Having the right weather technology in place helps viewers have a more comprehensive understanding of how weather will impact traffic or their plans.
Our weather graphics solutions
Here at The Weather Company, we know the benefits of weather graphics. That’s why we have cultivated solutions that help meteorologists stand out from the rest. Our solutions provide graphics that are data-driven, visually appealing, interactive, and unique.
Max Reality
Use augmented reality forecasts to create dynamic 3D storm imagery that entices and engages audiences.
Use augmented reality forecasts to create dynamic 3D images of storms to entice and engage audiences.
Max Storm
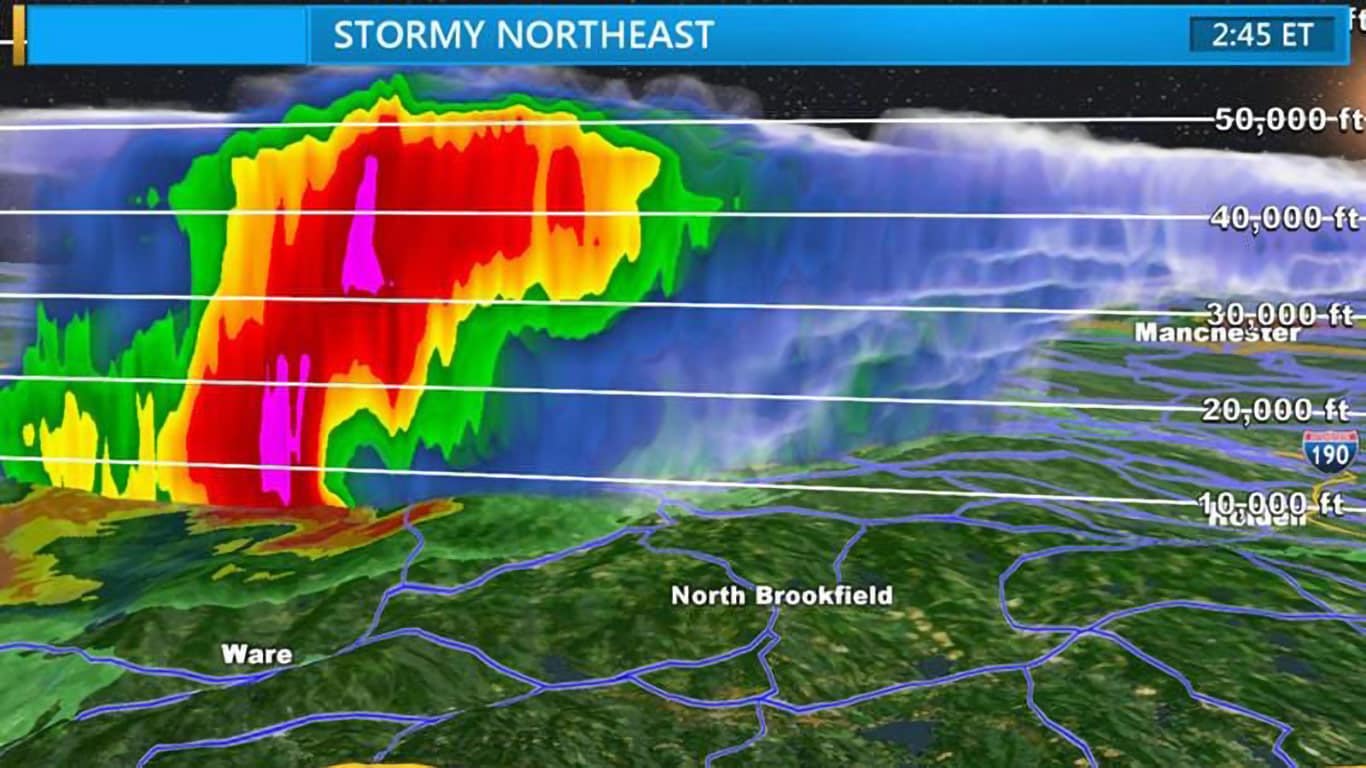
Create stunning visuals using 3D weather radar to bring your forecasts to life.
Max Traffic
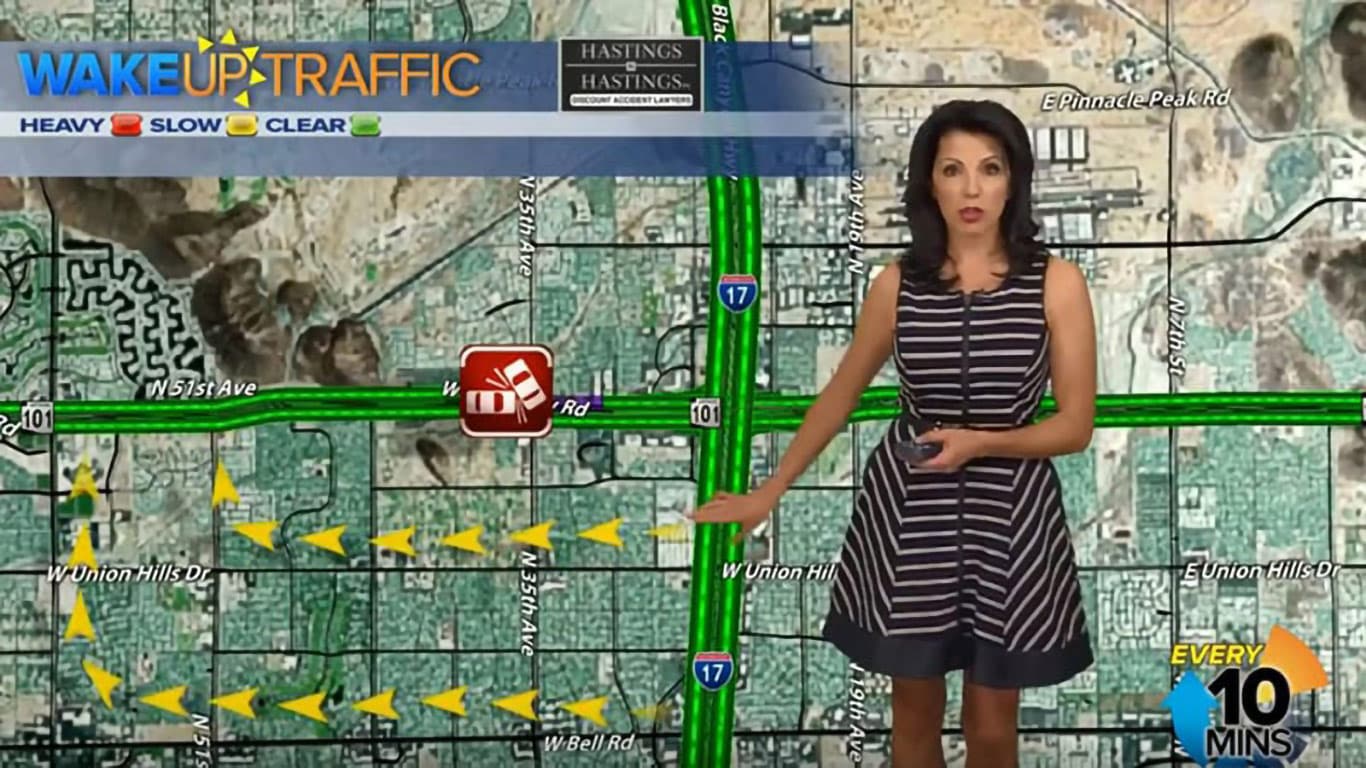
Use Max Traffic to combine traffic and weather data to create compelling and streamlined images for your forecast.
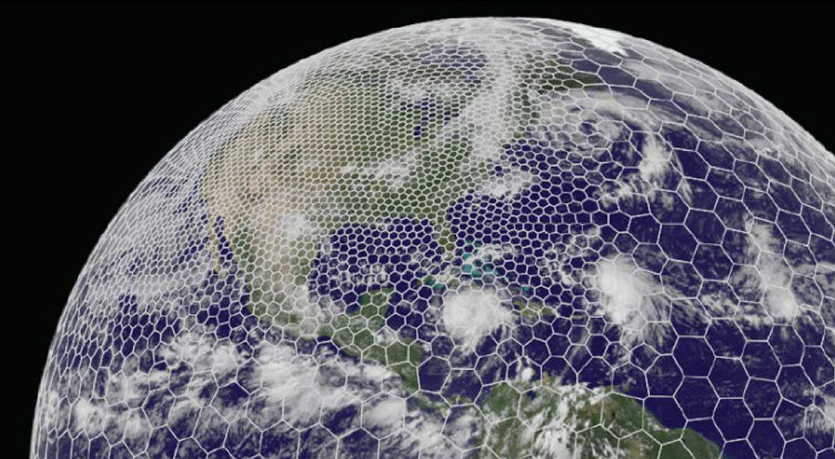
MAXimum Earth
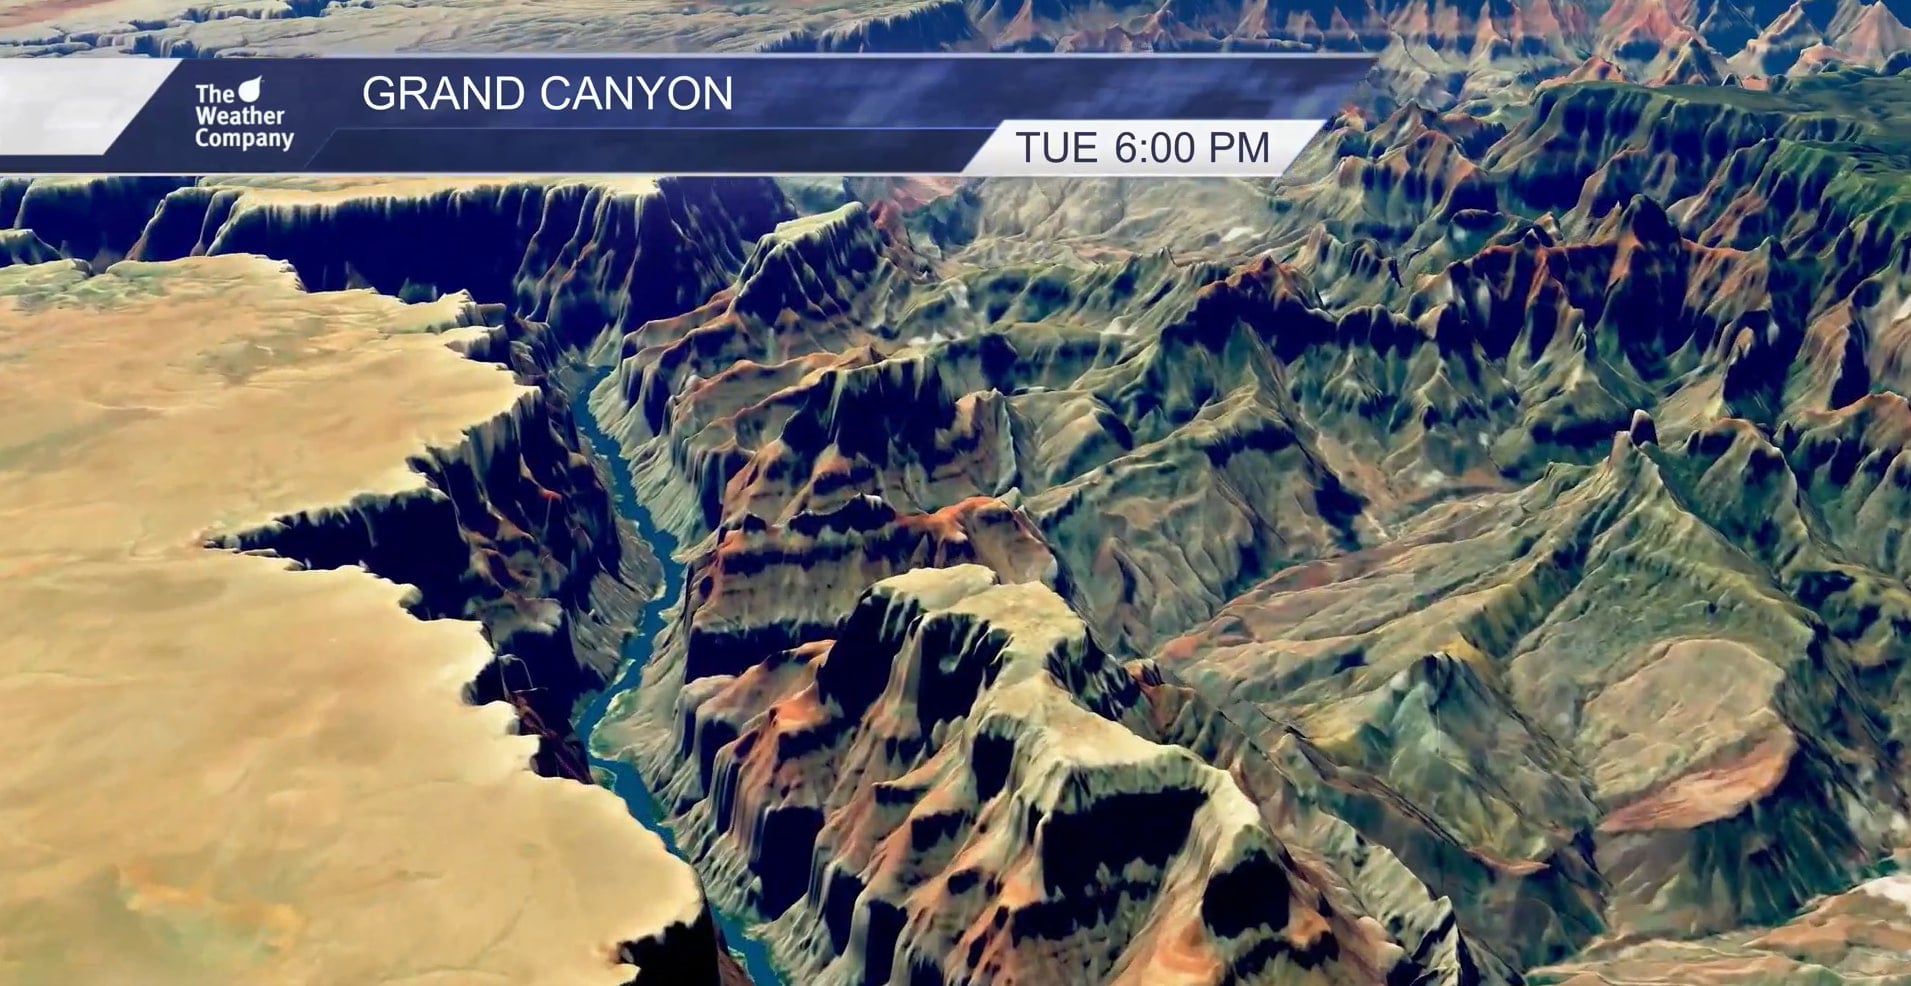
Weather map software and visualization tools make it easy to incorporate detailed and textured 3D map views. As a result, your team can create an experience that stands out from competitors.
Max Sky
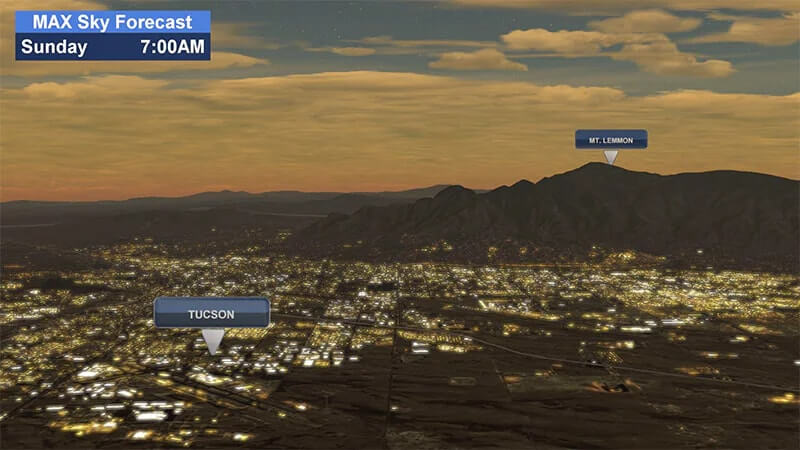
Use over 200 cloud templates, advanced particle animations, and atmospheric effects to create an engaging and unique broadcast.
Why use The Weather Company?
Delivering quality, engaging weather graphics is a top priority for us here at The Weather Company. With our solutions, engage your viewers with intriguing visuals that can help build loyalty. With the ability to share the weather—or even traffic—forecast quickly, your consumers can feel better knowing that they’re getting the most accurate information and can plan their day accordingly.
Ready to find out more about the benefits of having top-of-the-line weather graphics and how you can implement them into your broadcast? Contact us today.
Frequently asked questions
A weather report graphic is a display used to show a viewer a forecast of current or upcoming weather conditions. These forecast graphics are a tool used by a news team to communicate the impact the weather will have on viewers.
From 2017-2022, ForecastWatch has favored The Weather Company out of 23 weather forecast providers based on 84 metrics.
ForecastWatch, Global and Regional Weather Forecast Accuracy Overview, 2017-2022, commissioned by The Weather Company.
Meteorologists use a wide variety of tools to predict, analyze, and communicate the weather. Weather forecast graphics are an important tool in a meteorologist’s arsenal since they can effectively showcase the impact weather will have on a local community.
Related resources


Let’s talk
To learn more about our professional weather and traffic software solutions for the media industry, contact our media experts today.
Contact us