The latest GRAF® weather model improvements
Continue reading

What are weather maps?
Weather maps are visual representations of meteorological data that provide insights into various aspects of weather conditions. They serve as visual aids to understand elements like temperature, pressure, wind patterns, pollen levels and more. Weather maps come in various forms, including 2D and 3D formats, enabling meteorologists to communicate complex weather patterns so viewers can make informed decisions.
What is weather map software and how does it work?
Weather map software is a specialized tool used to create, analyze and visualize meteorological data in the form of maps and charts. It helps forecasters present complex weather information in a user-friendly and visually engaging manner.
The functioning of weather map software involves several key steps. First, weather forecasting relies on numerical physics models that incorporate atmospheric conditions such as temperature variations, pressure systems, wind patterns, and precipitation levels. These models are processed through powerful computers to generate conceptual representations of potential weather scenarios. Once meteorologists review and assess these models for accuracy, they must communicate the weather to the public.
This selected model is then input into the software, where advanced algorithms and data processing techniques transform the numerical data into graphical weather maps. In essence, weather map software bridges the gap between intricate meteorological models and user-friendly visualizations.
Why is weather map software important?
By offering a clear and concise visual representation of atmospheric conditions, weather maps enable meteorologists, researchers and the general public to grasp complex data quickly and make informed decisions. For example, commuters can glance quickly at a weather map to see what precipitation they need to prepare for during their travel to work.
Moreover, weather map software directly contributes to public safety by tracking and predicting severe weather events like hurricanes, blizzards, tornadoes and thunderstorms. It empowers meteorologists and emergency responders to issue timely severe weather warnings, implement evacuation plans and minimize the impact of natural disasters.
How are weather maps used today for weather visualizations?
Weather maps stand as indispensable instruments at the forefront of meteorological communication and decision-making. Here are three examples of how they’re most commonly used in the field:
Future forecasting
Weather maps are instrumental in predicting long-term weather trends. These maps provide valuable insights that extend beyond immediate forecasts, offering individuals and businesses the ability to proactively plan for upcoming weather conditions.
Day-to-day forecasting
Weather maps play a crucial role in daily weather predictions, facilitating the process of anticipating atmospheric conditions for each day. They provide valuable insights that empower individuals to make informed decisions based on real-time weather information. By offering up-to-date forecasts, these maps assist people in planning their activities and adapting to changing weather conditions as they unfold.
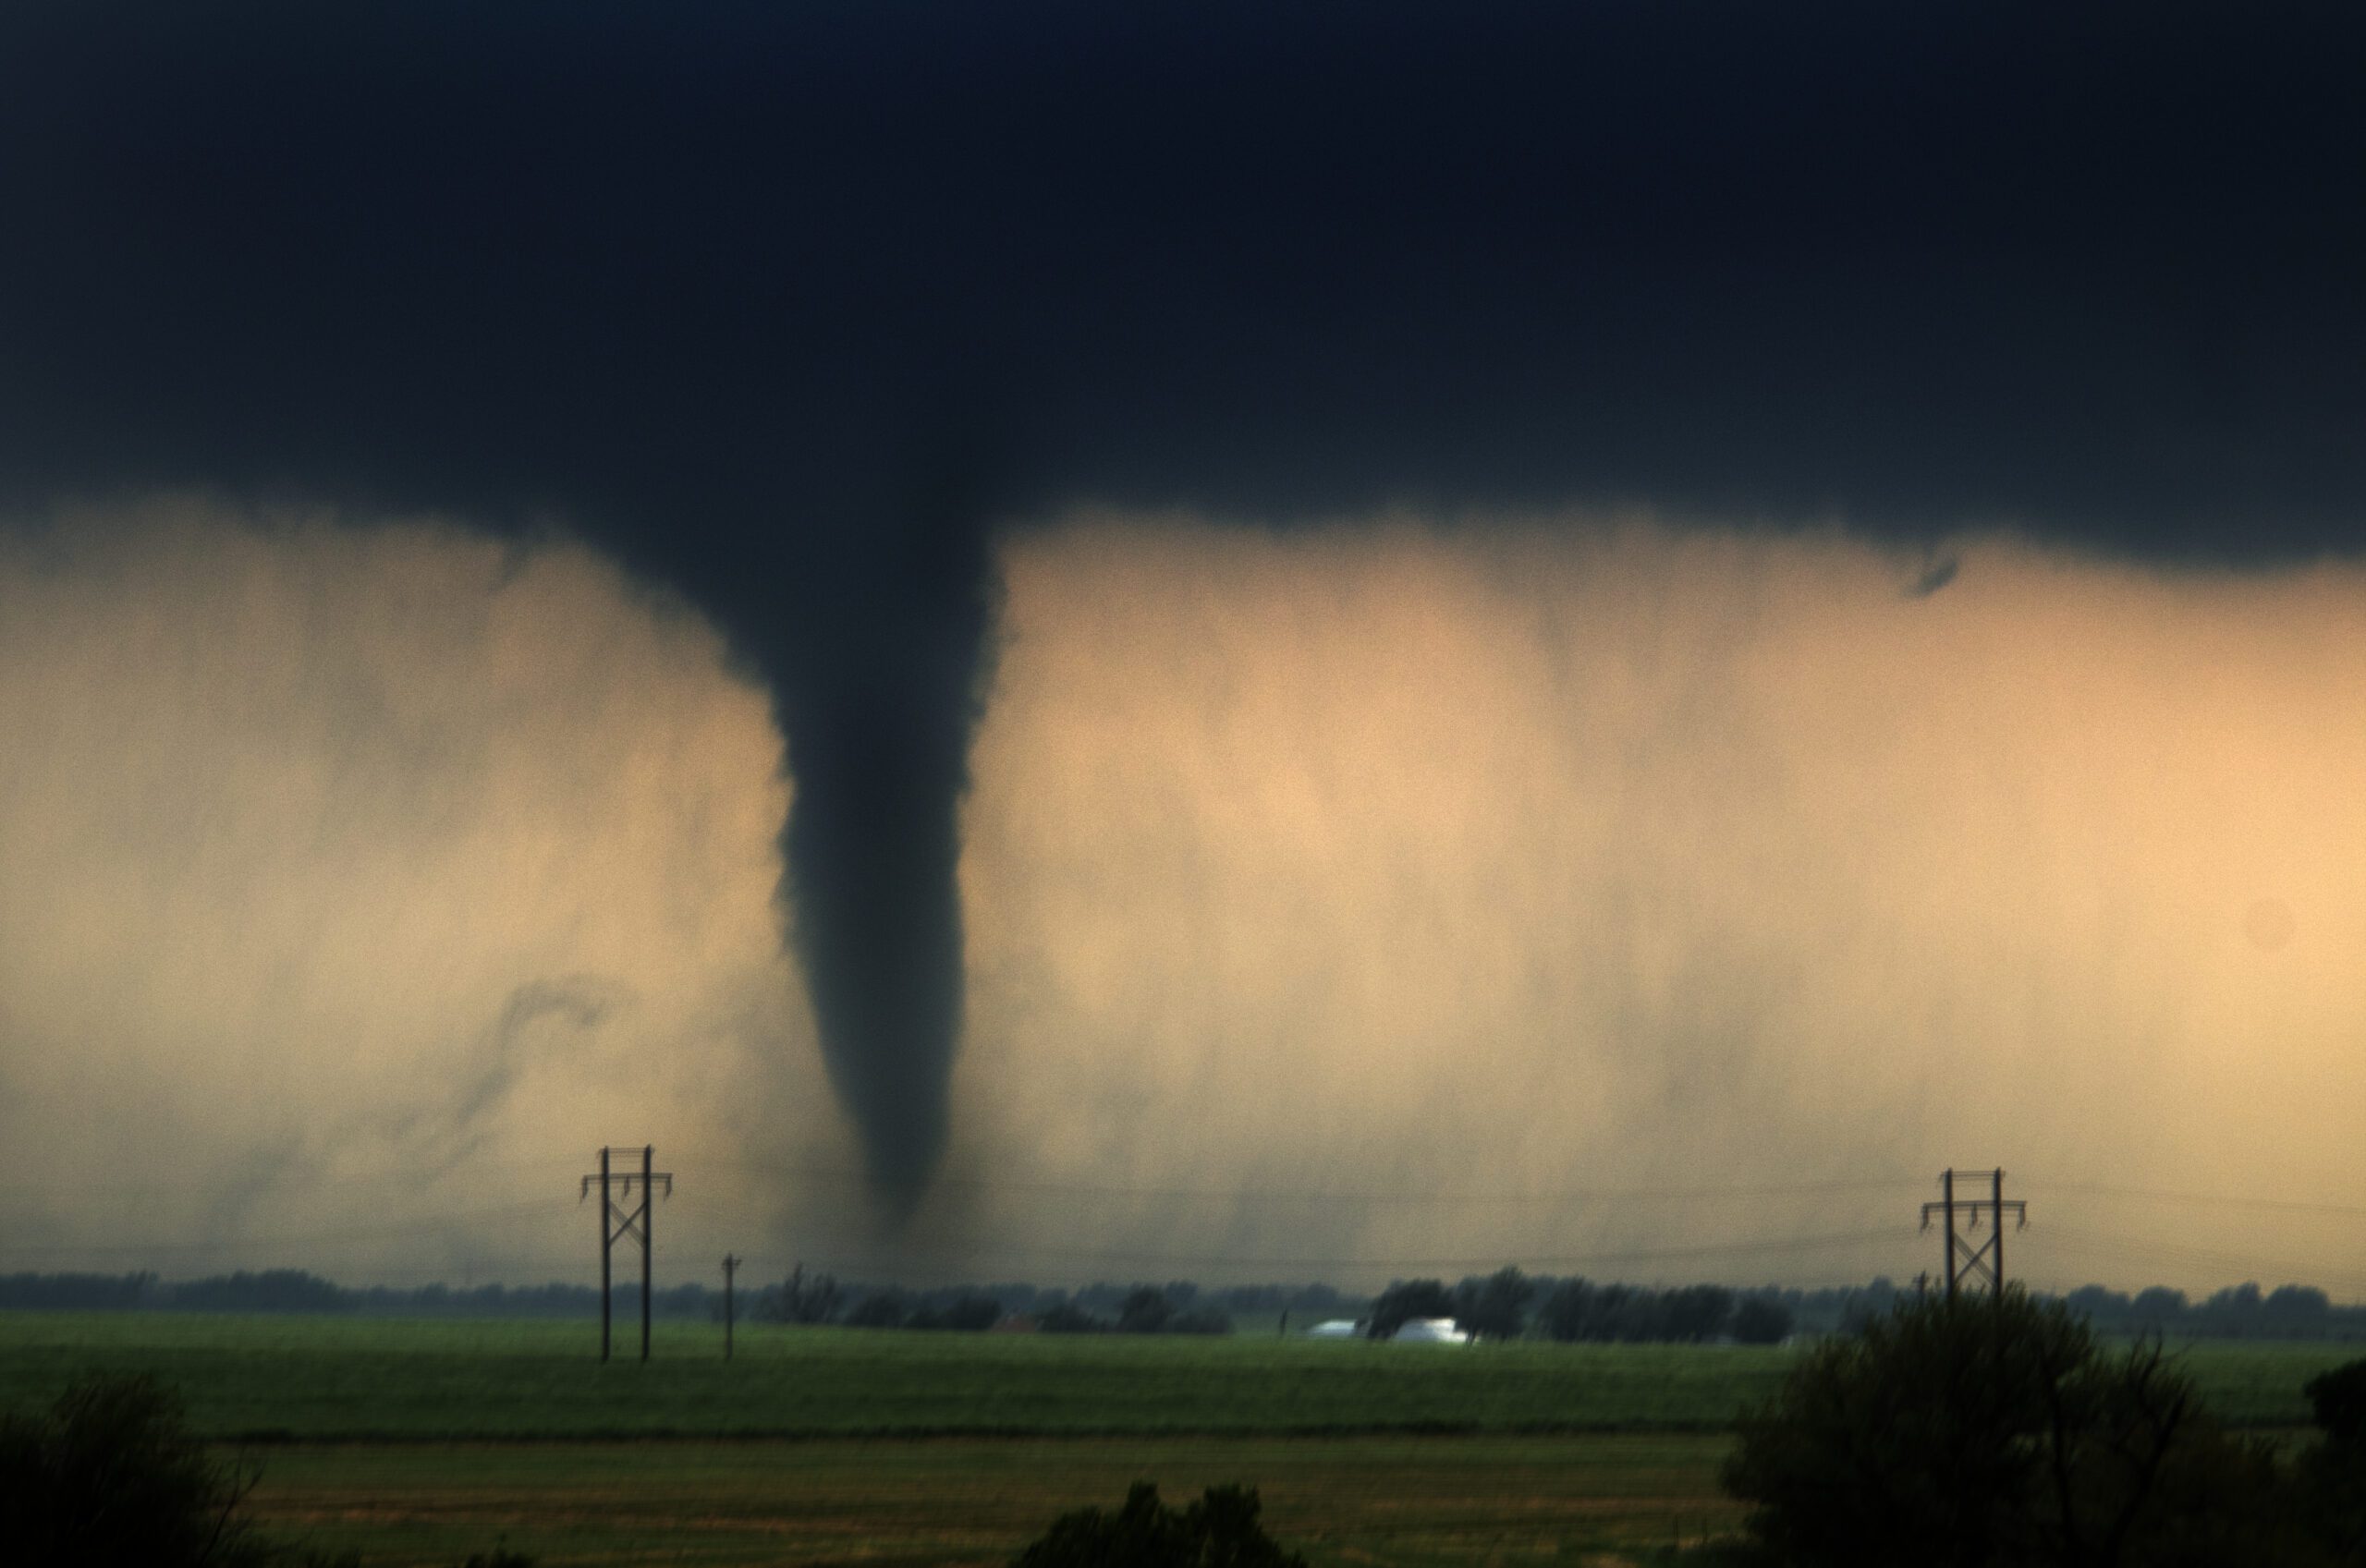
Severe storms
Weather maps play a critical role in both predicting and tracking severe weather events, serving as essential tools in bolstering preparedness and safety measures. By offering insights into the development and movement of extreme weather phenomena, these maps enable timely warnings and effective emergency responses. Through their ability to highlight potential risks, weather maps contribute significantly to minimizing the impact of severe weather and safeguarding communities and infrastructure.
Components of a weather map
Weather maps are more than just a collection of data points; they serve as dynamic visual tools that convey a wealth of meteorological information. Here are the six primary components that make up weather maps:
1. Weather graphics
Weather maps incorporate visually engaging graphics that convey a range of weather-related information. These weather graphics not only provide a snapshot of current conditions, but also effectively illustrate trends such as temperature variations, wind patterns and precipitation levels. This visual representation makes meteorological data more accessible for both experts and the general public, contributing to a better understanding of complex atmospheric dynamics.
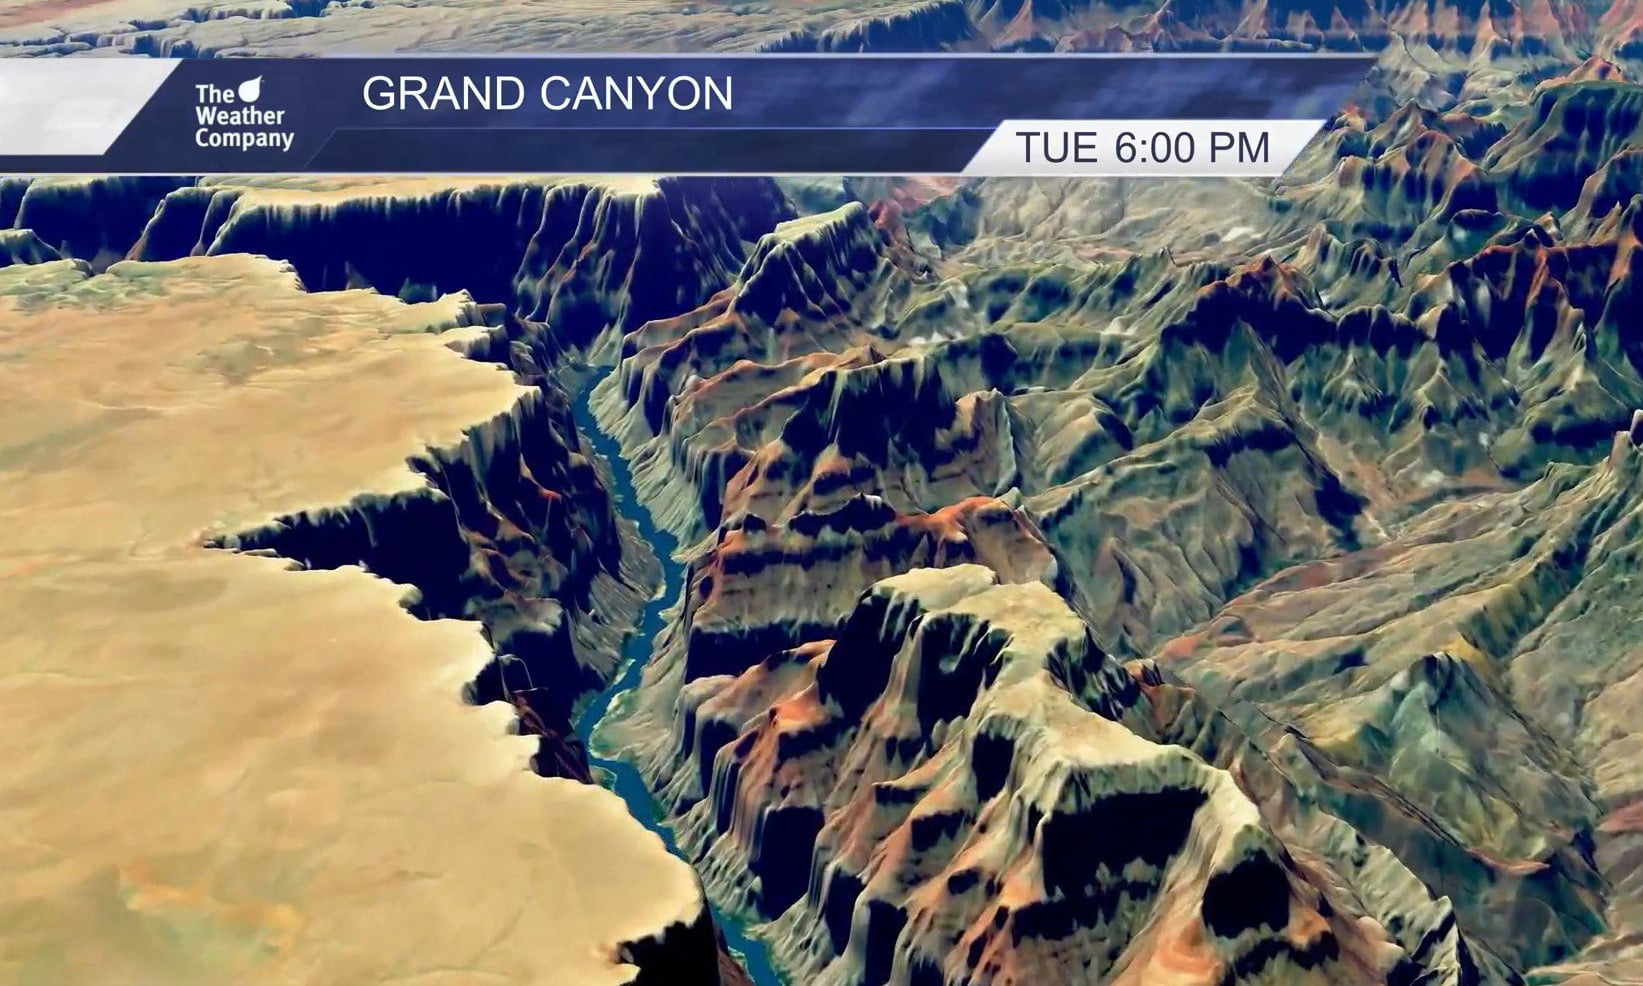
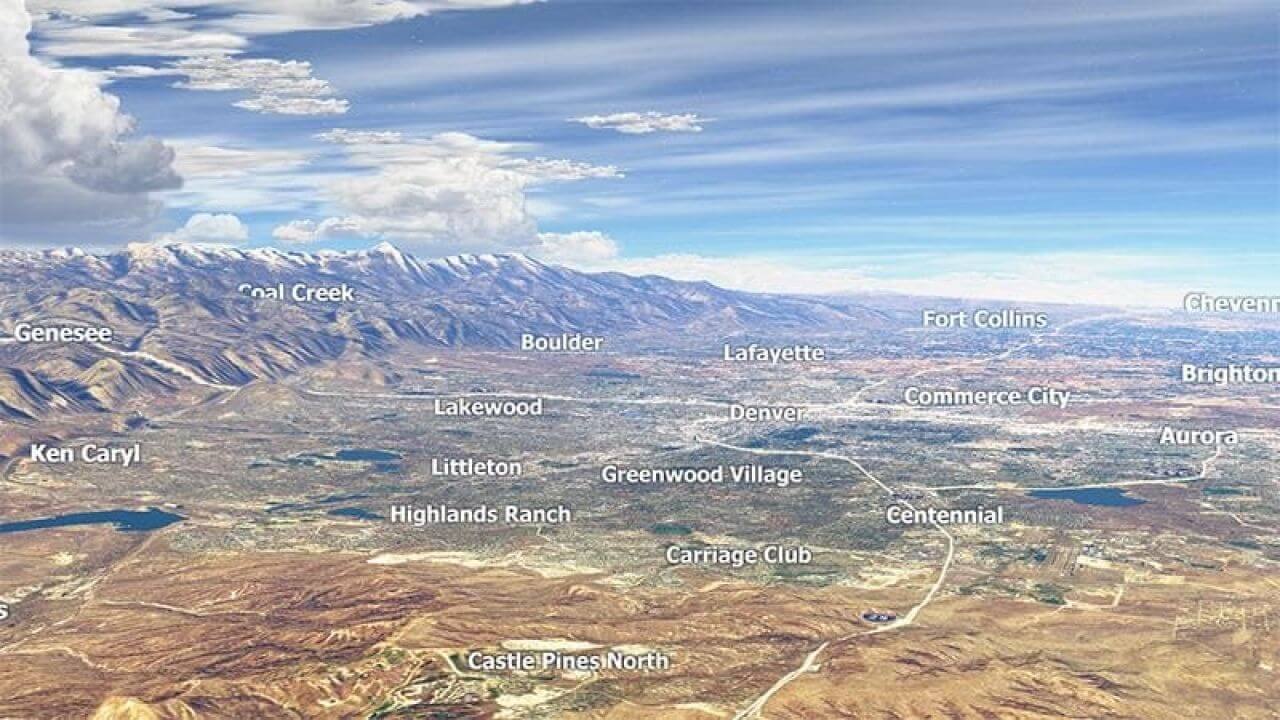
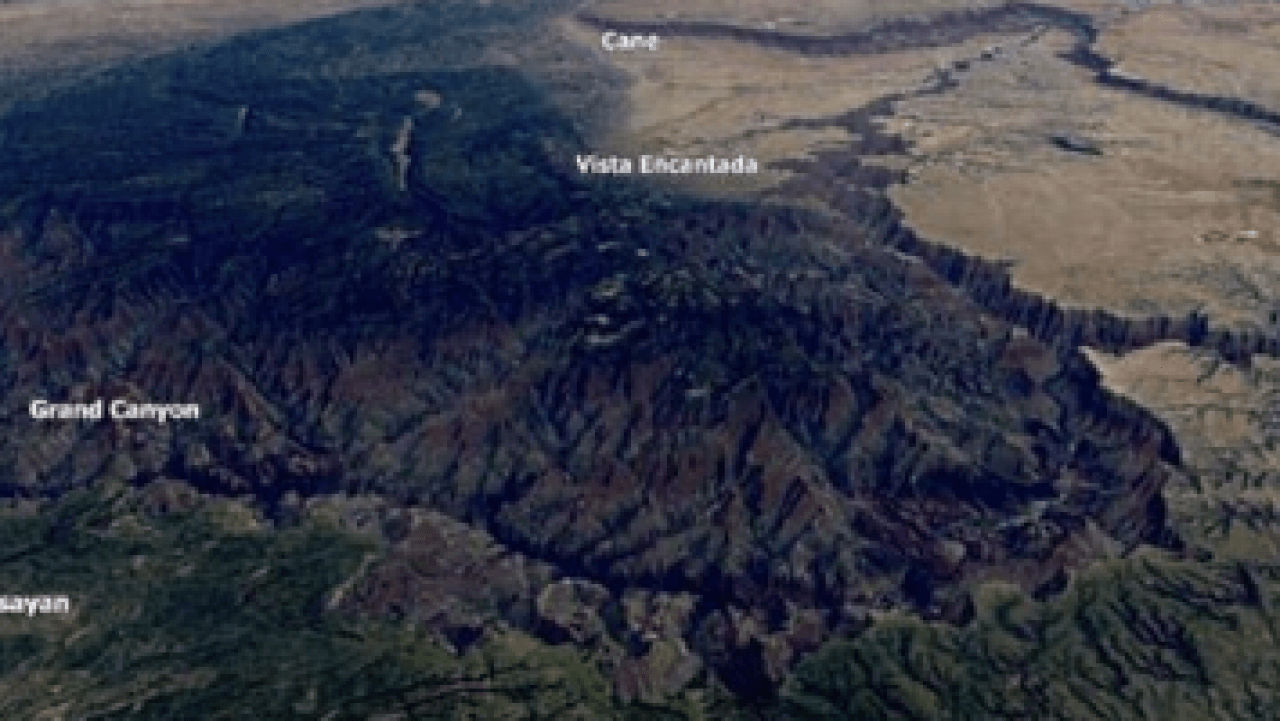
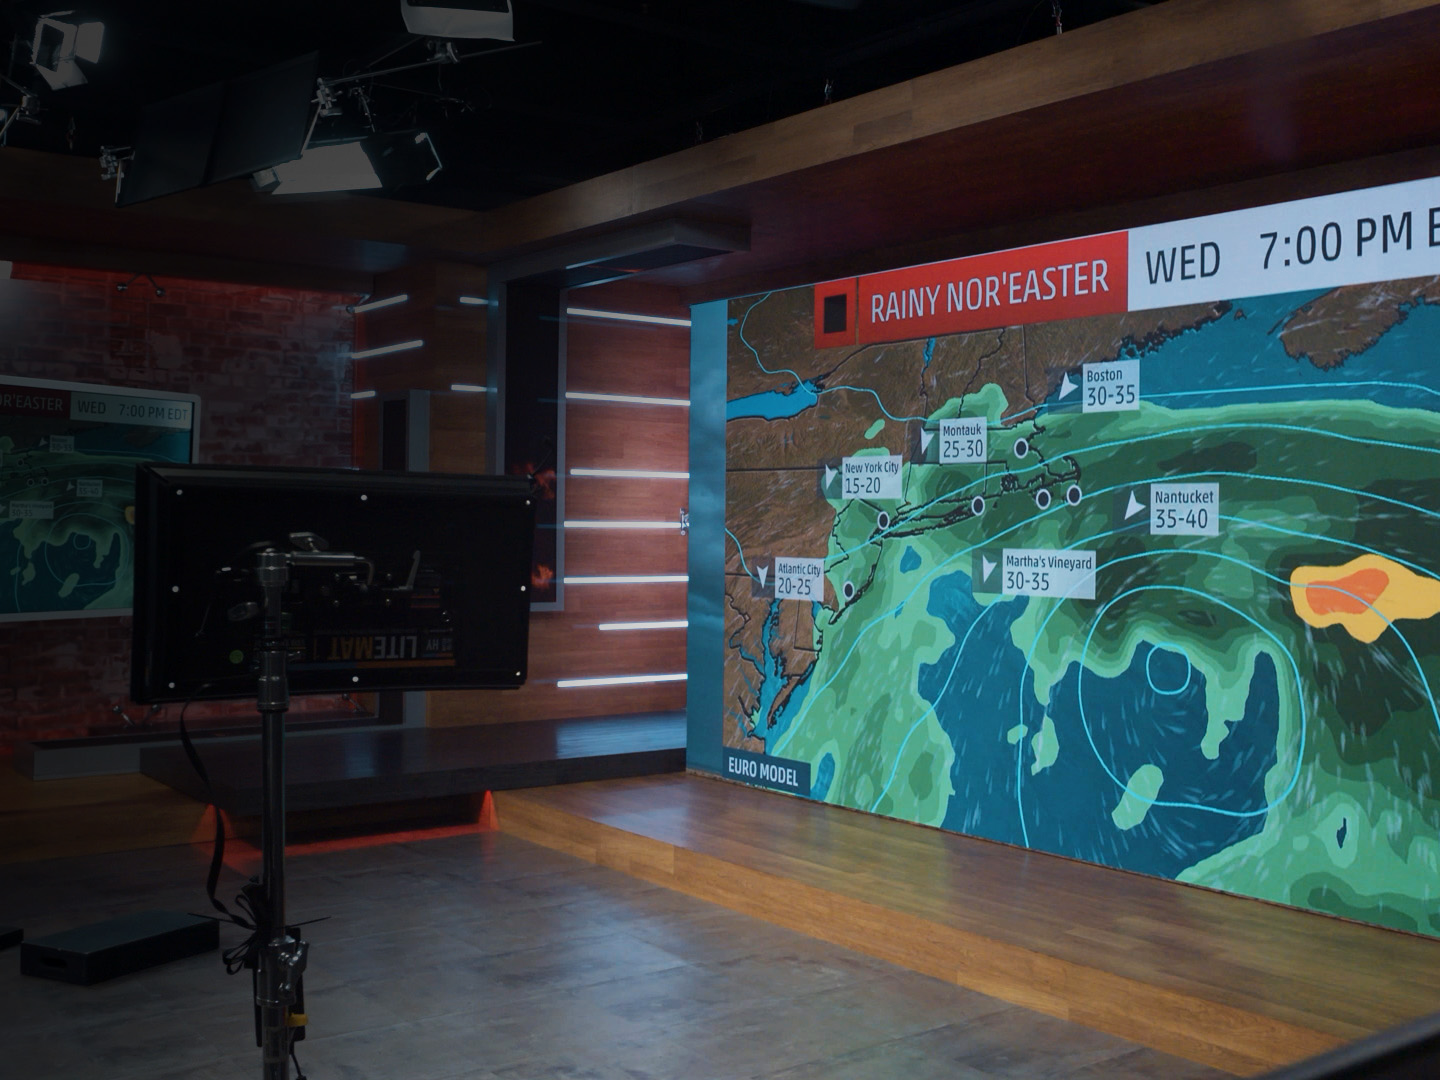
2. Landscape mapping
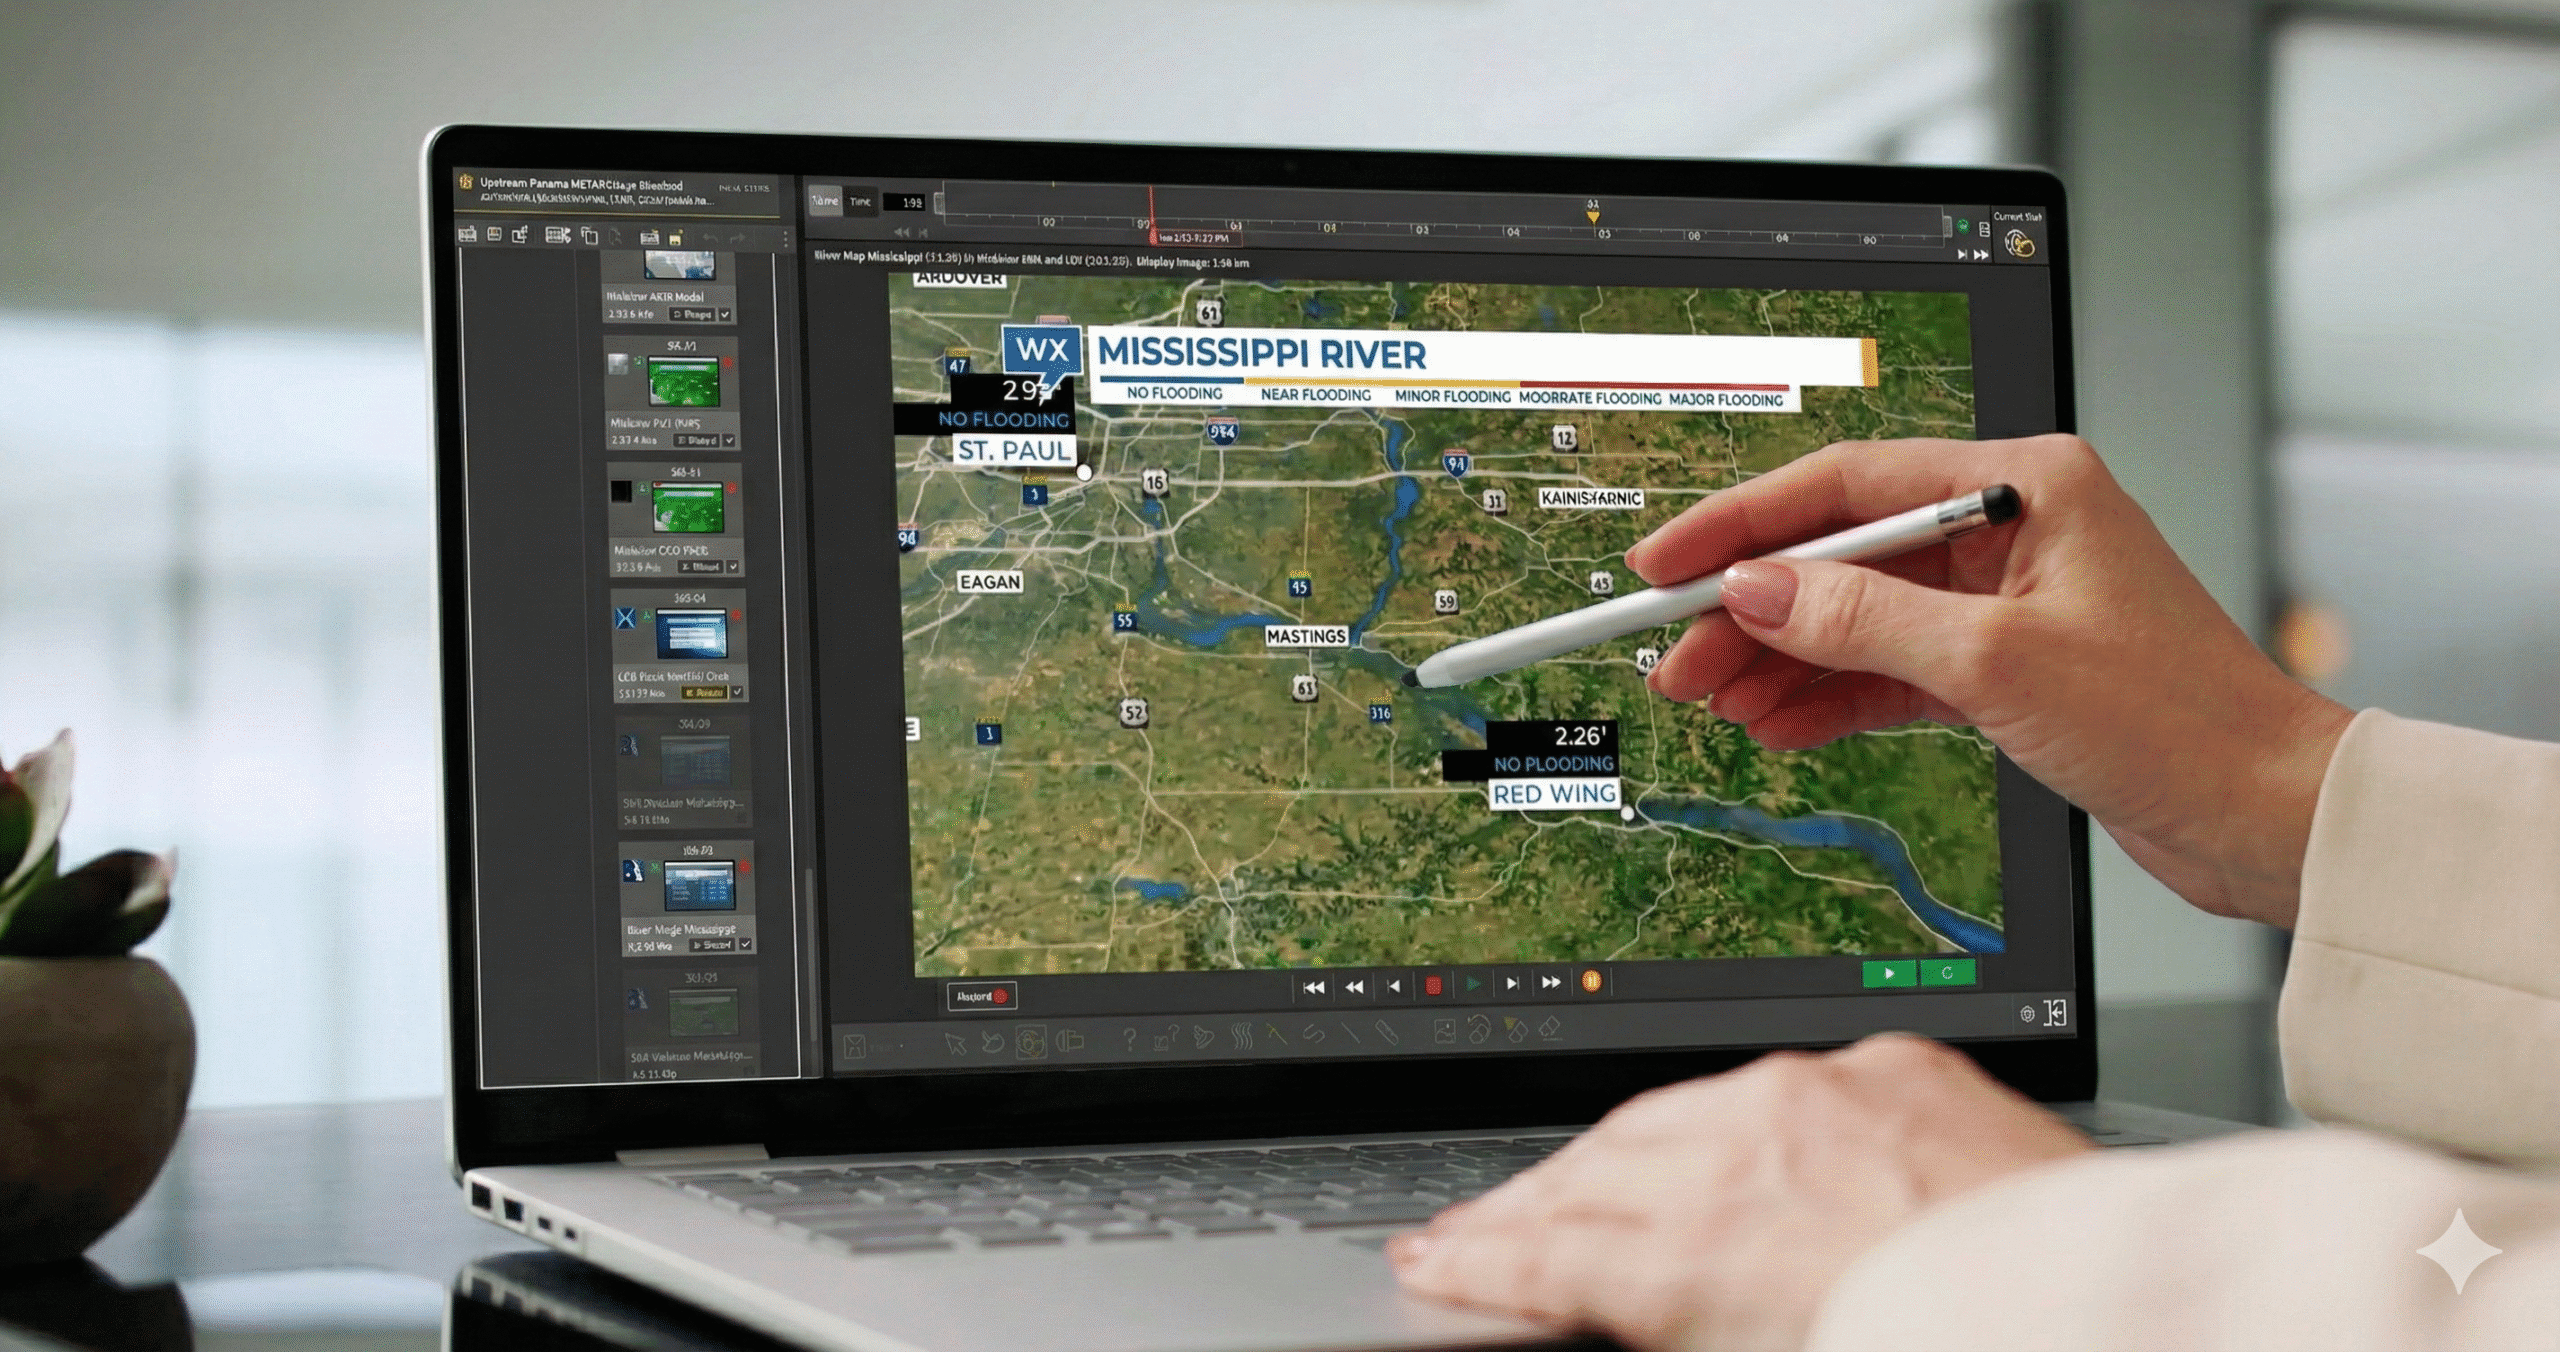
Landscape mapping involves overlaying data about weather conditions onto geographical landscapes, creating a visual representation that enhances the understanding of how weather phenomena interact with the physical environment. This technique integrates spatial relationships and geographical context, allowing users to observe weather patterns in relation to topography, bodies of water, and urban areas.
As TV screens and devices continue to deliver better resolution, it’s important for meteorologists to consider the landscapes they are using. Weather map visualization and software tools, such as MAXimum Earth, use cutting-edge rendering techniques to create more realistic animations. This tool allows meteorologists to incorporate stunning visuals of different bodies of water and mountains into their weather reports. As a result, they can offer more compelling imagery in 4K resolution.
3. Pressure areas
Pressure maps serve as critical components of weather maps, shedding light on high and low-pressure regions across geographical areas. These pressure differentials are pivotal in driving atmospheric circulation, influencing wind patterns and weather systems. By highlighting pressure gradients, weather maps provide insights into the movement and intensification of weather phenomena, facilitating more accurate forecasting and enhancing our comprehension of global atmospheric dynamics.
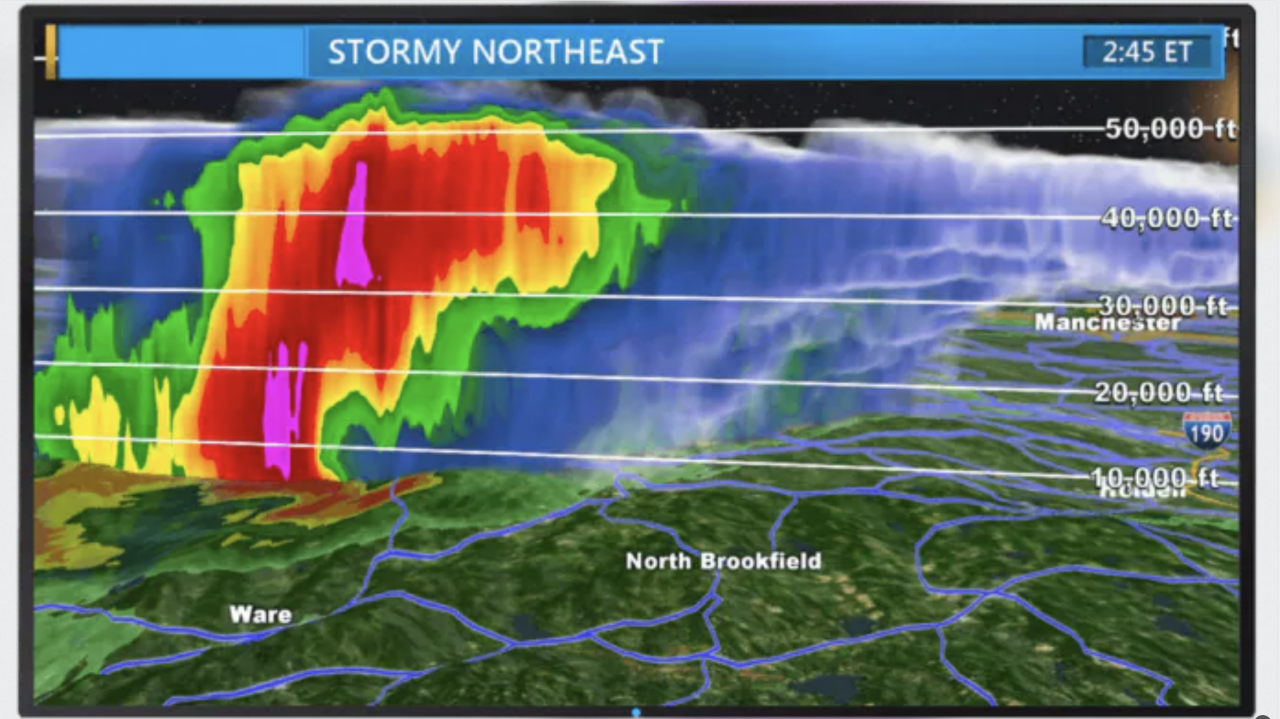
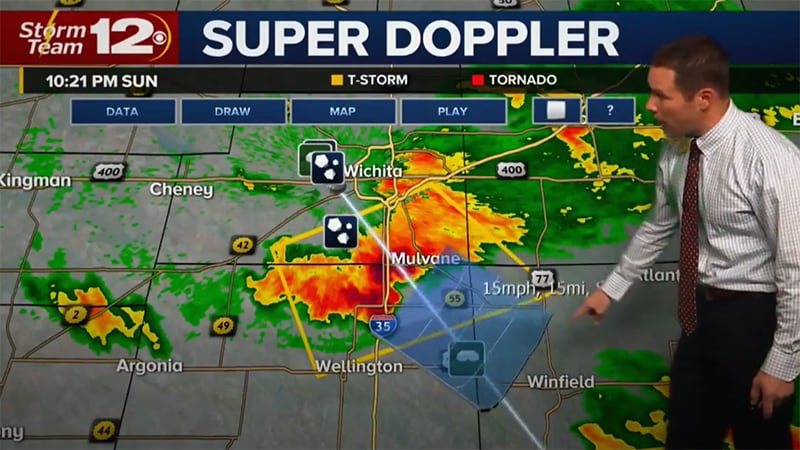
4. 3D weather radar
3D weather radar is an advanced technology that provides three-dimensional images of precipitation patterns within the atmosphere. Unlike traditional radar systems that offer two-dimensional views, The Weather Company’s Max Storm 3D weather radar captures the vertical distribution of precipitation, allowing meteorologists to analyze the intensity, altitude and movement of rain, snow and other forms of precipitation.
5. Temperature fronts
Temperature fronts delineate boundaries between air masses with different temperatures. Understanding the location and movement of these fronts is fundamental in predicting shifts in weather conditions, including not just temperature changes but also wind patterns, cloud formation and precipitation. By helping to visualize these temperature gradients, weather maps aid meteorologists in anticipating evolving weather scenarios and communicating them to the public.
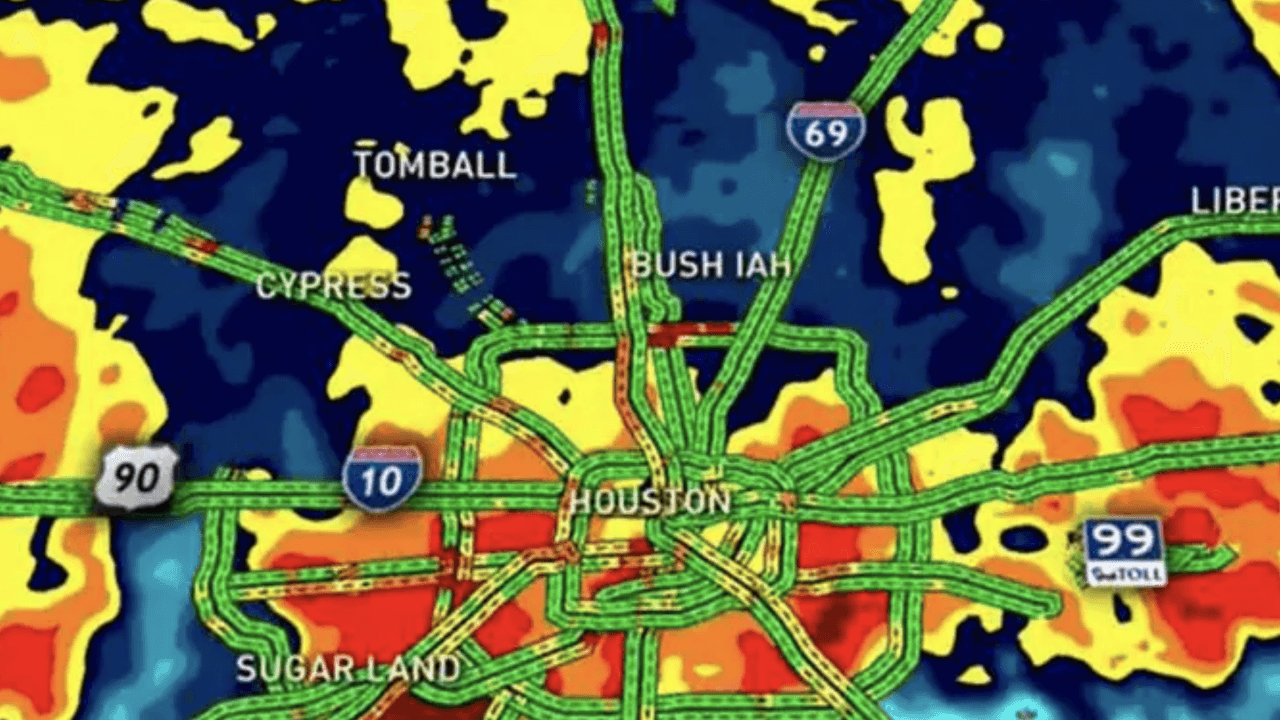
6. Traffic
Weather maps can also incorporate traffic data, allowing users to plan routes and travel more efficiently. By understanding how real-time weather conditions interact with commute times, individuals can make informed decisions about their journeys, considering factors such as road safety, visibility and potential delays due to adverse weather. This integration of weather and traffic data enhances safety and convenience, catering to the practical needs of commuters and travelers alike.
What are the most common weather map projections?
The creation of weather maps involves projecting Earth’s spherical surface onto a flat map. This process always distorts the map to some degree, so mapmakers must choose projection methods carefully depending on where the map needs to be the most accurate. Here are three of the most common projections:
- Cylindrical projections depict the globe’s surface as if wrapped around a cylinder. This results in equal spacing of longitude lines but can cause distortion as one moves away from the equator, making them suitable for showing weather patterns over broad regions.
- Conic projections project the Earth’s surface onto an imaginary cone positioned over the North or South Pole. These projections are often used for mapping mid-latitude areas. They minimize distortion in these regions but can cause issues near the poles.
- Plane projections, also known as azimuthal projections, project the Earth’s surface onto a flat plane from a single point. These are particularly useful for depicting polar regions and maintaining accurate directions, but they exhibit distortion when portraying larger areas.
What is the most accurate weather map software?
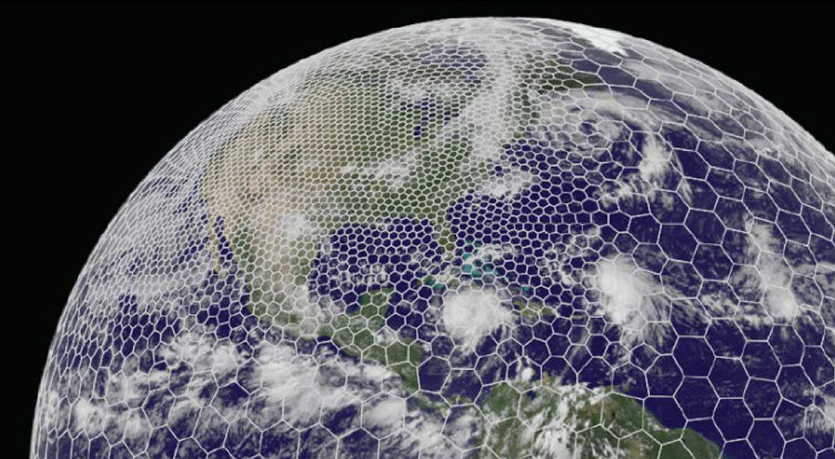
According to ForecastWatch, The Weather Company is the world’s most accurate weather forecaster overall across regions including the US, Canada, Central America, South America, Europe, Africa, the Middle East, and Asia-Pacific, making it a globally trusted source for reliable weather information. With predictions powered by the Global High-Resolution Atmospheric Forecasting System (GRAF), The Weather Company is able to provide highly accurate weather maps displaying up-to-the-minute information.
What does the future of weather map software look like?
As technology continues to advance, the future holds the promise of even more sophisticated weather maps that have the potential to revolutionize how we perceive and understand meteorological data.
One exciting prospect is the ability to provide forecasts at a zip-code level, offering a remarkable degree of localized accuracy that caters to specific communities and neighborhoods. Additionally, advancements in data analysis, modeling techniques and the implementation of AI in weather forecasting could lead to enhanced long-term forecasting capabilities, providing individuals, industries and governments with more accurate and reliable insights into weather trends that extend further into the future than is currently possible today.
What are the current challenges of weather map software?
While weather forecasting technology has advanced considerably in recent decades, several challenges persist. The inherent complexity of atmospheric systems limits the accuracy of weather predictions. While meteorologists harness advanced numerical models and sophisticated data assimilation techniques to improve forecast precision, there are too many unknown factors to reach absolute certainty.
Moreover, it’s a challenge to tailor weather maps to a highly personalized scale. While technology enables us to provide increasingly localized forecasts, geographic limitations can get in the way of providing fully accurate information. It’s difficult to account for all the variations in topography, microclimates and urban heat islands that can affect weather across a very small area. However, as weather map software continues to evolve, it will become better and better at addressing these geographic intricacies.
Developing engaging weather visualizations with Max products
Within its suite of weather map products, The Weather Company offers a range of powerful solutions including Max Storm, MAXimum Earth, Max Traffic, Max Sky, and GRAF. Among these, MAXimum Earth stands out as an exceptional tool tailored for broadcasters and media applications. This advanced weather display software specializes in landscape mapping, seamlessly integrating meteorological data onto geographical landscapes.
Particularly advantageous for broadcasters, MAXimum Earth elevates weather visualization by offering a more immersive and contextual experience. By enhancing spatial relationships and providing real-world context, MAXimum Earth empowers broadcasters to deliver more engaging and informative weather presentations to their audiences.
Frequently asked questions
The Weather Company consistently stands out in the realm of accurate weather forecast providers and weather visualization tools. From 2017 to 2022, its prowess was recognized by ForecastWatch, earning accolades for its precision among a competitive field of 23 forecast providers. This sustained recognition underscores The Weather Company’s dedication to delivering reliable and dependable weather information to its users.
Weather maps serve as invaluable tools for meteorologists in deciphering and anticipating various atmospheric conditions. By visualizing critical factors such as precipitation, temperature fronts and wind speed, meteorologists can effectively interpret complex data. This enables them to not only comprehend the intricacies of weather changes but also to communicate these fluctuations comprehensively to the public, enhancing awareness and preparedness.
Meteorologists rely on a plethora of data sources to craft accurate and insightful weather maps. These sources include satellite observations that provide a bird’s-eye view of global atmospheric patterns and radar data which offer real-time insights into precipitation and storm movements. By harnessing these diverse data streams, meteorologists can amalgamate information from different sources to generate comprehensive and precise weather visualizations that aid understanding and decision-making.
Let's talk
To learn more about our professional weather and traffic software solutions for the media industry, contact our media experts today.
Contact usRelated resources

1 ForecastWatch, Global and Regional Weather Forecast Accuracy Overview, 2017-2022, https://forecastwatch.com/AccuracyOverview2017-2022, commissioned by The Weather Company.